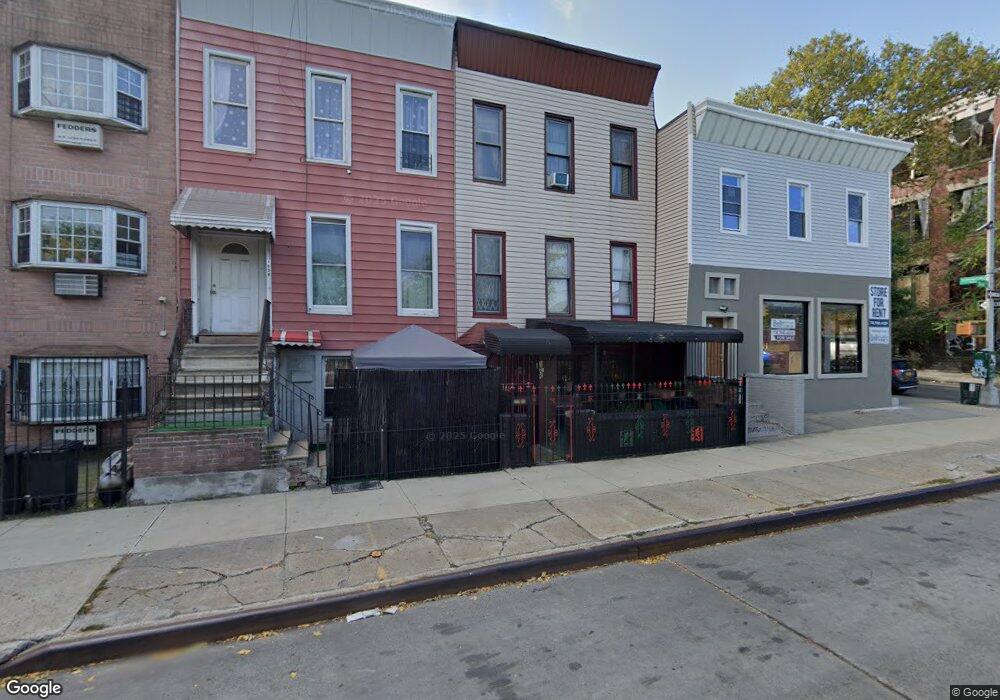
1656 Dean St Brooklyn, NY 11213
Crown Heights NeighborhoodEstimated Value: $989,954 - $1,428,000
--
Bed
--
Bath
2,106
Sq Ft
$559/Sq Ft
Est. Value
About This Home
This home is located at 1656 Dean St, Brooklyn, NY 11213 and is currently estimated at $1,177,239, approximately $558 per square foot. 1656 Dean St is a home located in Kings County with nearby schools including P.S. 243K- The Weeksville School and KIPP AMP Middle School.
Ownership History
Date
Name
Owned For
Owner Type
Purchase Details
Closed on
Jan 18, 2010
Sold by
Quick Grace and Quick Perry
Bought by
Grace E Quick As Trustee and Living Trust Of Perry L Quick Sr & Gra
Current Estimated Value
Purchase Details
Closed on
Dec 3, 1999
Sold by
Mr Foreclosure Inc
Bought by
Quick Perry and Quick Grace
Home Financials for this Owner
Home Financials are based on the most recent Mortgage that was taken out on this home.
Original Mortgage
$185,992
Interest Rate
7.91%
Mortgage Type
FHA
Purchase Details
Closed on
Aug 16, 1999
Sold by
Thomas Ralph
Bought by
Mr Foreclosure Inc
Purchase Details
Closed on
Apr 14, 1999
Sold by
Thomas Ralph
Bought by
Thomas Ralph and Thomas Charles David
Create a Home Valuation Report for This Property
The Home Valuation Report is an in-depth analysis detailing your home's value as well as a comparison with similar homes in the area
Home Values in the Area
Average Home Value in this Area
Purchase History
| Date | Buyer | Sale Price | Title Company |
|---|---|---|---|
| Grace E Quick As Trustee | -- | -- | |
| Grace E Quick As Trustee | -- | -- | |
| Quick Perry | $188,000 | Stewart Title Insurance Co | |
| Quick Perry | $188,000 | Stewart Title Insurance Co | |
| Mr Foreclosure Inc | $103,000 | Commonwealth Land Title Ins | |
| Mr Foreclosure Inc | $103,000 | Commonwealth Land Title Ins | |
| Thomas Ralph | -- | -- | |
| Thomas Ralph | -- | -- |
Source: Public Records
Mortgage History
| Date | Status | Borrower | Loan Amount |
|---|---|---|---|
| Previous Owner | Quick Perry | $185,992 |
Source: Public Records
Tax History Compared to Growth
Tax History
| Year | Tax Paid | Tax Assessment Tax Assessment Total Assessment is a certain percentage of the fair market value that is determined by local assessors to be the total taxable value of land and additions on the property. | Land | Improvement |
|---|---|---|---|---|
| 2025 | $2,166 | $74,640 | $15,540 | $59,100 |
| 2024 | $2,166 | $87,840 | $15,540 | $72,300 |
| 2023 | $2,051 | $85,440 | $15,540 | $69,900 |
| 2022 | $1,880 | $86,940 | $15,540 | $71,400 |
| 2021 | $1,860 | $71,520 | $15,540 | $55,980 |
| 2020 | $923 | $59,760 | $15,540 | $44,220 |
| 2019 | $1,831 | $54,180 | $15,540 | $38,640 |
| 2018 | $1,656 | $9,583 | $3,977 | $5,606 |
| 2017 | $1,544 | $9,045 | $3,031 | $6,014 |
| 2016 | $1,397 | $8,536 | $3,716 | $4,820 |
| 2015 | $809 | $8,533 | $5,572 | $2,961 |
| 2014 | $809 | $8,460 | $5,343 | $3,117 |
Source: Public Records
Map
Nearby Homes
- 1735 Pacific St
- 111 Schenectady Ave
- 118 Utica Ave
- 141 Schenectady Ave
- 107 Utica Ave
- 147 Schenectady Ave
- 1615 Bergen St Unit 3
- 1770 Pacific St
- 22 Hattie Jones Ct
- 1582A Pacific St
- 1796 Pacific St
- 1248 Prospect Place
- 1607 Pacific St Unit 3 A
- 176 Utica Ave
- 1226 St Marks Ave Unit 1 B
- 1226 St Marks Ave Unit 4B
- 1226 St Marks Ave Unit 3 B
- 1614 Atlantic Ave
- 47 Chauncey St Unit 1685/75
- 99 Chauncey St
- 1658 Dean St
- 1654 Dean St
- 1662 Dean St
- 1662 Dean St Unit 1
- 103 Schenectady Ave
- 1664 Dean St
- 105 Schenectady Ave
- 1666 Dean St Unit 4Bb
- 1666 Dean St Unit 1Ff
- 1666 Dean St Unit 1Bb
- 1666 Dean St Unit 2R
- 1666 Dean St Unit 4F
- 1666 Dean St Unit 1B
- 1666 Dean St Unit 4B
- 1666 Dean St
- 1666 Dean St Unit 3B
- 1666 Dean St Unit 4-R
- 1666 Dean St Unit 3-R
- 1666 Dean St Unit 2F
- 1666 Dean St Unit 1F