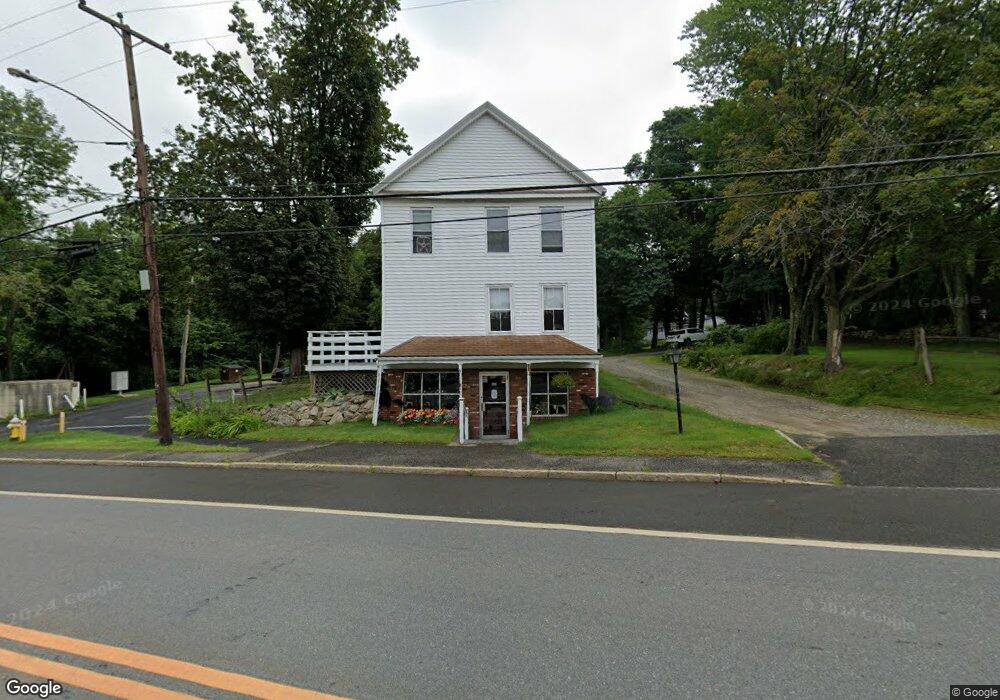
1656 Main St Unit 1660 Jefferson, MA 01522
Estimated Value: $311,173
5
Beds
4
Baths
1,053
Sq Ft
$296/Sq Ft
Est. Value
About This Home
This home is located at 1656 Main St Unit 1660, Jefferson, MA 01522 and is currently estimated at $311,173, approximately $295 per square foot. 1656 Main St Unit 1660 is a home located in Worcester County with nearby schools including Wachusett Regional High School and Holden Christian Academy.
Ownership History
Date
Name
Owned For
Owner Type
Purchase Details
Closed on
Oct 7, 2003
Sold by
Anz Rt and Gaval
Bought by
Jakobsen Tracy and Jakobsen Wayne
Current Estimated Value
Home Financials for this Owner
Home Financials are based on the most recent Mortgage that was taken out on this home.
Original Mortgage
$130,500
Outstanding Balance
$60,093
Interest Rate
6.25%
Mortgage Type
Commercial
Estimated Equity
$251,080
Purchase Details
Closed on
May 29, 2002
Sold by
Chandler Theron
Bought by
Gaval Mansour
Home Financials for this Owner
Home Financials are based on the most recent Mortgage that was taken out on this home.
Original Mortgage
$155,000
Interest Rate
6.84%
Mortgage Type
Commercial
Purchase Details
Closed on
Apr 16, 2002
Sold by
Dunn Dwight F and Dunn William L
Bought by
1654 Main St Rt and Chandler Theron
Home Financials for this Owner
Home Financials are based on the most recent Mortgage that was taken out on this home.
Original Mortgage
$155,000
Interest Rate
6.84%
Mortgage Type
Commercial
Create a Home Valuation Report for This Property
The Home Valuation Report is an in-depth analysis detailing your home's value as well as a comparison with similar homes in the area
Home Values in the Area
Average Home Value in this Area
Purchase History
| Date | Buyer | Sale Price | Title Company |
|---|---|---|---|
| Jakobsen Tracy | $145,000 | -- | |
| Jakobsen Tracy | $145,000 | -- | |
| Gaval Mansour | $157,000 | -- | |
| Gaval Mansour | $157,000 | -- | |
| 1654 Main St Rt | $122,500 | -- | |
| 1654 Main St Rt | $122,500 | -- |
Source: Public Records
Mortgage History
| Date | Status | Borrower | Loan Amount |
|---|---|---|---|
| Open | Jakobsen Tracy | $130,500 | |
| Closed | 1654 Main St Rt | $130,500 | |
| Previous Owner | 1654 Main St Rt | $155,000 |
Source: Public Records
Tax History Compared to Growth
Tax History
| Year | Tax Paid | Tax Assessment Tax Assessment Total Assessment is a certain percentage of the fair market value that is determined by local assessors to be the total taxable value of land and additions on the property. | Land | Improvement |
|---|---|---|---|---|
| 2025 | $5,602 | $404,200 | $116,100 | $288,100 |
| 2024 | $5,971 | $422,000 | $112,700 | $309,300 |
| 2023 | $6,105 | $407,300 | $98,000 | $309,300 |
| 2022 | $5,619 | $339,300 | $76,500 | $262,800 |
| 2021 | $5,561 | $319,600 | $72,900 | $246,700 |
| 2020 | $4,962 | $291,900 | $69,400 | $222,500 |
| 2019 | $4,841 | $277,400 | $69,400 | $208,000 |
| 2018 | $4,656 | $264,400 | $66,100 | $198,300 |
| 2017 | $4,566 | $259,600 | $66,100 | $193,500 |
| 2016 | $4,071 | $236,000 | $63,000 | $173,000 |
| 2015 | -- | $227,400 | $63,000 | $164,400 |
| 2014 | $4,036 | $227,400 | $63,000 | $164,400 |
Source: Public Records
Map
Nearby Homes
- 40 Princeton St
- 40 Jackson St
- 3 Oakridge Rd
- 141 Lovell Rd
- 35 Laurel Hill Ln
- 100 Avery Heights Dr
- 9 Short St
- 60 Duxbury Dr
- 26 Avery Heights Dr
- 16 Highland Ave
- 2226 Main St
- 56 Highland Ave
- 216 Reservoir St Unit 103
- 216 Reservoir St Unit 309
- 33 Thorny Lea Rd
- 124 Bailey Rd
- 33 Meadow Wood Dr
- 7 Holmes Dr
- 9 Holmes Dr
- 289 Bailey Rd
- 1650 Main St
- 1664 Main St
- 1664 Main St Unit 1st flr
- 1664 Main St Unit 2
- 1664 Main St
- 1664 Main St Unit 2nd flr
- 29 Princeton St
- 1655 Main St
- 35 Princeton St
- 35 Princeton St
- 22 Princeton St Unit 24
- 22-24 Princeton St
- 1635 Main St
- 1672-A Main St
- 1672A Main St
- 41 Princeton St
- 41 Princeton St
- 195 High St
- 197 High St
- 10 Princeton St