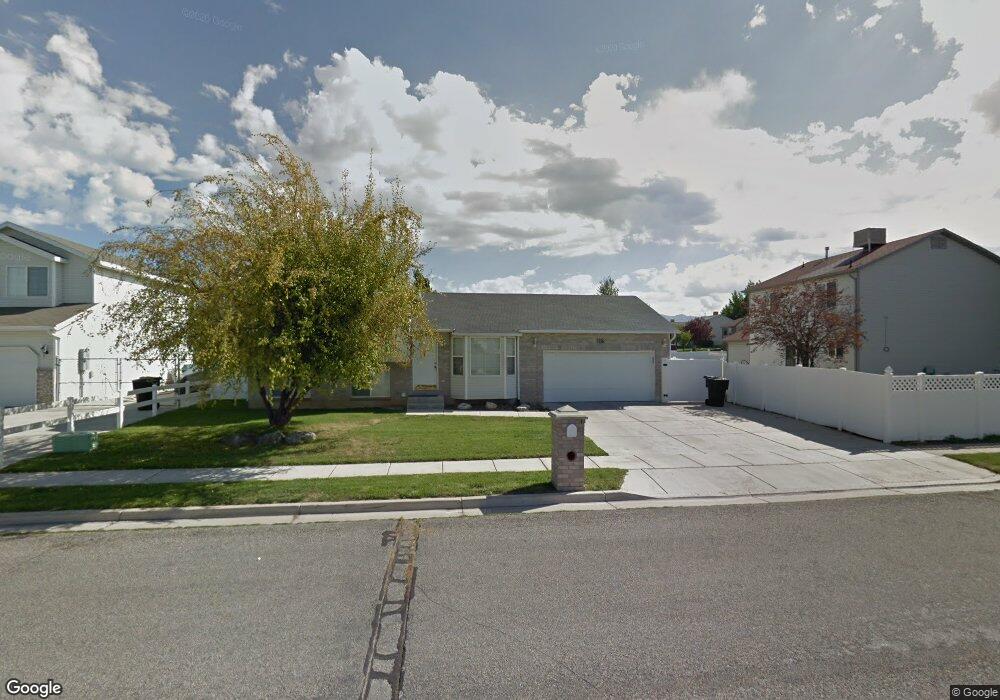
1656 N 2140 W Clearfield, UT 84015
Estimated Value: $398,000 - $436,000
3
Beds
1
Bath
1,081
Sq Ft
$387/Sq Ft
Est. Value
About This Home
This home is located at 1656 N 2140 W, Clearfield, UT 84015 and is currently estimated at $418,332, approximately $386 per square foot. 1656 N 2140 W is a home located in Davis County with nearby schools including Parkside Elementary School, West Point Junior High School, and Clearfield High School.
Ownership History
Date
Name
Owned For
Owner Type
Purchase Details
Closed on
Nov 21, 2014
Sold by
Campbell Cormick G
Bought by
Campbell Raquel K
Current Estimated Value
Home Financials for this Owner
Home Financials are based on the most recent Mortgage that was taken out on this home.
Original Mortgage
$86,000
Outstanding Balance
$65,684
Interest Rate
3.92%
Mortgage Type
New Conventional
Estimated Equity
$352,648
Purchase Details
Closed on
Mar 19, 1998
Sold by
John L Higley Llc
Bought by
Campbell Cormick G and Campbell Raquel K
Home Financials for this Owner
Home Financials are based on the most recent Mortgage that was taken out on this home.
Original Mortgage
$89,800
Interest Rate
7.02%
Purchase Details
Closed on
Jun 10, 1997
Sold by
Mark Higley Construction Lc
Bought by
John L Higley Llc
Create a Home Valuation Report for This Property
The Home Valuation Report is an in-depth analysis detailing your home's value as well as a comparison with similar homes in the area
Home Values in the Area
Average Home Value in this Area
Purchase History
| Date | Buyer | Sale Price | Title Company |
|---|---|---|---|
| Campbell Raquel K | -- | None Available | |
| Campbell Cormick G | -- | Bonneville Title Company Inc | |
| John L Higley Llc | -- | First American Title Co |
Source: Public Records
Mortgage History
| Date | Status | Borrower | Loan Amount |
|---|---|---|---|
| Open | Campbell Raquel K | $86,000 | |
| Closed | Campbell Cormick G | $89,800 |
Source: Public Records
Tax History Compared to Growth
Tax History
| Year | Tax Paid | Tax Assessment Tax Assessment Total Assessment is a certain percentage of the fair market value that is determined by local assessors to be the total taxable value of land and additions on the property. | Land | Improvement |
|---|---|---|---|---|
| 2025 | $2,105 | $202,400 | $86,993 | $115,407 |
| 2024 | $2,031 | $196,350 | $95,964 | $100,386 |
| 2023 | $1,856 | $332,000 | $108,586 | $223,414 |
| 2022 | $1,985 | $196,350 | $67,156 | $129,194 |
| 2021 | $1,812 | $266,000 | $82,833 | $183,167 |
| 2020 | $1,570 | $228,000 | $69,736 | $158,264 |
| 2019 | $1,508 | $214,000 | $82,697 | $131,303 |
| 2018 | $1,392 | $194,000 | $70,008 | $123,992 |
| 2016 | $1,222 | $87,945 | $27,124 | $60,821 |
| 2015 | $1,262 | $86,350 | $27,124 | $59,226 |
| 2014 | -- | $82,320 | $27,124 | $55,196 |
| 2013 | -- | $81,425 | $25,731 | $55,694 |
Source: Public Records
Map
Nearby Homes
- 2148 W 1570 N
- 1694 N 2225 W
- 2259 W 1800 N
- 1502 N 2090 W
- 1458 N 2400 W
- 1509 N 2475 W
- 1449 N 2475 W
- 1923 W 1340 N
- 2616 N 2125 W Unit 147
- 2034 N 2095 W
- 1331 N 1850 W
- 1317 N 1850 W
- 2371 W 1300 N
- 1648 N 2615 W
- 2647 W 1445 N
- 1251 N 2525 W
- 2184 N 2000 W
- Harvard Plan at Summerfield - Enclave
- 2208 W 2615 N
- Linden Plan at Summerfield - Vista
- 1634 N 2140 W
- 1662 N 2140 W
- 2122 W 1630 N Unit 41
- 2122 W 1630 N
- 2106 W 1630 N
- 1678 N 2140 W
- 1678 N 2140 W Unit 38
- 2094 W 1630 N
- 2094 W 1630 N Unit 43
- 1641 N 2140 W
- 2151 W 1680 N
- 1663 N 2140 W
- 2119 W 1630 N
- 2127 W 1630 N
- 2158 W 1630 N
- 2163 W 1680 N
- 2139 W 1630 N
- 2136 W 1680 N
- 2136 W 1680 N Unit 37
- 2078 W 1630 N