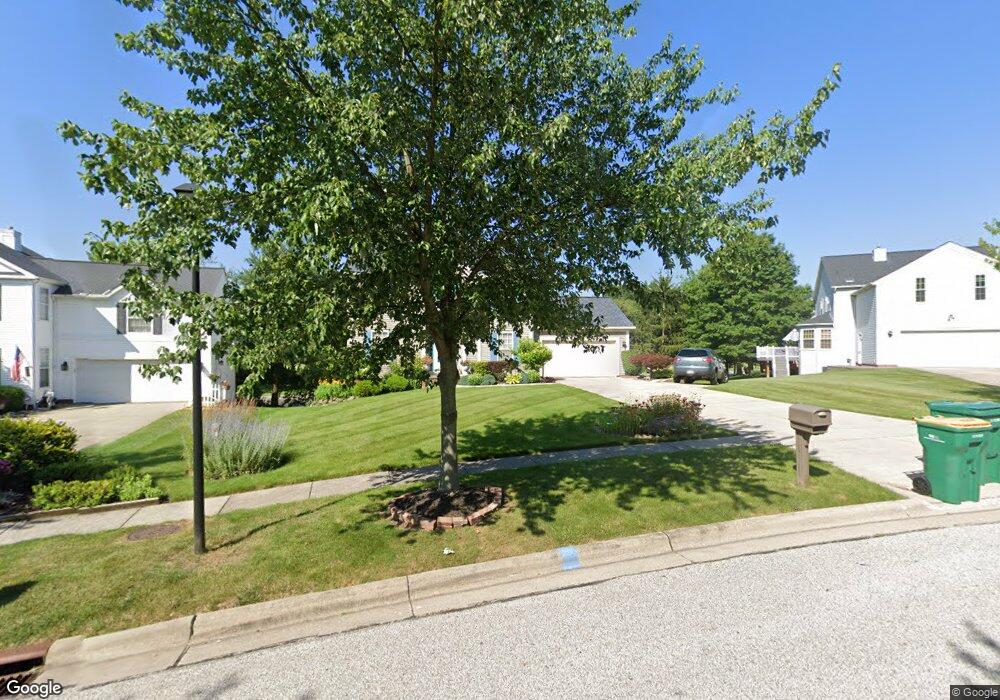
1656 Newport Cove Twinsburg, OH 44087
Estimated Value: $422,000 - $441,000
4
Beds
4
Baths
2,245
Sq Ft
$193/Sq Ft
Est. Value
About This Home
This home is located at 1656 Newport Cove, Twinsburg, OH 44087 and is currently estimated at $432,554, approximately $192 per square foot. 1656 Newport Cove is a home located in Summit County with nearby schools including Wilcox Primary School, Samuel Bissell Elementary School, and Dodge Intermediate School.
Ownership History
Date
Name
Owned For
Owner Type
Purchase Details
Closed on
Oct 20, 2020
Sold by
Given Not
Bought by
Henry Hermine E and Herd Eureka A
Current Estimated Value
Home Financials for this Owner
Home Financials are based on the most recent Mortgage that was taken out on this home.
Original Mortgage
$240,000
Interest Rate
2.9%
Mortgage Type
New Conventional
Purchase Details
Closed on
Dec 23, 2019
Sold by
Henry Hermine E
Bought by
Henry Hermine E and Herd Eureka A
Home Financials for this Owner
Home Financials are based on the most recent Mortgage that was taken out on this home.
Original Mortgage
$231,990
Interest Rate
3.6%
Mortgage Type
FHA
Purchase Details
Closed on
Aug 30, 2007
Sold by
Nevery Thomas A and Nevery Beth A
Bought by
Henry Hermine E
Home Financials for this Owner
Home Financials are based on the most recent Mortgage that was taken out on this home.
Original Mortgage
$244,710
Interest Rate
6.79%
Mortgage Type
Purchase Money Mortgage
Create a Home Valuation Report for This Property
The Home Valuation Report is an in-depth analysis detailing your home's value as well as a comparison with similar homes in the area
Home Values in the Area
Average Home Value in this Area
Purchase History
| Date | Buyer | Sale Price | Title Company |
|---|---|---|---|
| Henry Hermine E | -- | Servicelink | |
| Henry Hermine E | $271,900 | Erieview Title Agency Llc | |
| Henry Hermine E | -- | -- |
Source: Public Records
Mortgage History
| Date | Status | Borrower | Loan Amount |
|---|---|---|---|
| Previous Owner | Henry Hermine E | $240,000 | |
| Previous Owner | Henry Hermine E | $231,990 | |
| Previous Owner | Henry Hermine E | $244,710 |
Source: Public Records
Tax History Compared to Growth
Tax History
| Year | Tax Paid | Tax Assessment Tax Assessment Total Assessment is a certain percentage of the fair market value that is determined by local assessors to be the total taxable value of land and additions on the property. | Land | Improvement |
|---|---|---|---|---|
| 2025 | $5,392 | $121,199 | $25,505 | $95,694 |
| 2024 | $5,392 | $121,199 | $25,505 | $95,694 |
| 2023 | $5,392 | $121,199 | $25,505 | $95,694 |
| 2022 | $4,286 | $88,204 | $18,893 | $69,311 |
| 2021 | $4,307 | $88,204 | $18,893 | $69,311 |
| 2020 | $4,177 | $88,200 | $18,890 | $69,310 |
| 2019 | $4,627 | $90,990 | $15,110 | $75,880 |
| 2018 | $4,534 | $90,990 | $15,110 | $75,880 |
| 2017 | $3,837 | $90,990 | $15,110 | $75,880 |
| 2016 | $3,814 | $82,530 | $15,110 | $67,420 |
| 2015 | $3,837 | $82,530 | $15,110 | $67,420 |
| 2014 | $3,830 | $82,530 | $15,110 | $67,420 |
| 2013 | $3,923 | $84,390 | $15,110 | $69,280 |
Source: Public Records
Map
Nearby Homes
- 9964 Crestwood Dr
- 1621 Ridgewood Ct
- 1780 Rolling Hills Dr Unit B
- 1816 Westwood Dr
- SL 2 Chamberlin Rd
- 1883 Edgewood Dr
- 10060 Ridgewood Dr
- 1902 Westwood Dr
- 9537 Ridge Ct Unit 7
- 9618 E Idlewood Dr
- 9452 Fairfield Dr
- 9639 E Idlewood Dr Unit E16
- 2015 Presidential Pkwy Unit G60
- 9571 Shepard Rd
- 2051 Presidential Pkwy
- 11285 Heritage Dr
- 10310 Dayflower Dr
- 9435 Airlane Dr
- 1516 Meadowlawn Dr
- 1830 Parker Ln
- 1664 Newport Cove
- 9789 Ridgewood Dr
- 1674 Newport Cove
- 9773 Ridgewood Dr
- 1680 Newport Cove
- 1655 Newport Cove
- 11006 Ravenna Rd
- 1669 Newport Cove
- 9796 Ridgewood Dr
- 9806 Ridgewood Dr
- 9788 Ridgewood Dr
- 1686 Newport Cove
- 1657 Iris Glen Dr
- 1651 Iris Glen Dr Unit 1651
- 9780 Ridgewood Dr
- 1677 Newport Cove
- 9816 Ridgewood Dr
- 11014 Ravenna Rd
- 1647 Iris Glen Dr
- 10971 Ravenna Rd