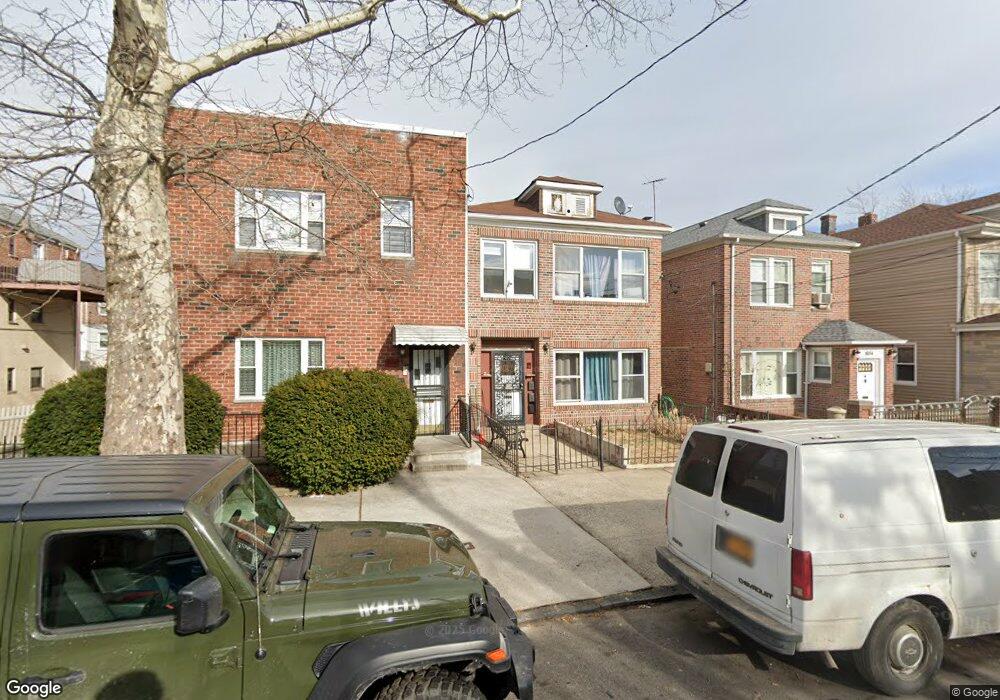
1656 Tomlinson Ave Bronx, NY 10461
Morris Park NeighborhoodEstimated Value: $857,000 - $1,050,000
--
Bed
--
Bath
2,680
Sq Ft
$355/Sq Ft
Est. Value
About This Home
This home is located at 1656 Tomlinson Ave, Bronx, NY 10461 and is currently estimated at $950,964, approximately $354 per square foot. 1656 Tomlinson Ave is a home located in Bronx County with nearby schools including P.S. 108 Philip J Abinanti, J.H.S. 144 Michelangelo, and Emblaze Academy Charter School.
Ownership History
Date
Name
Owned For
Owner Type
Purchase Details
Closed on
Jul 20, 2010
Sold by
Tinaj Anton
Bought by
Syku Joseph
Current Estimated Value
Purchase Details
Closed on
Mar 26, 2010
Sold by
U S Bank National Association
Bought by
Tinaj Anton
Purchase Details
Closed on
Aug 25, 2008
Sold by
Daniel Ferreira Esq Referee
Bought by
U S Bank National Association As Trust
Purchase Details
Closed on
Feb 15, 2005
Sold by
Santagada Peter
Bought by
Santagada Peter and Santagada Rose A
Purchase Details
Closed on
Nov 15, 2004
Sold by
Santagada Peter and Santagada Rose A
Bought by
Santagada Peter
Home Financials for this Owner
Home Financials are based on the most recent Mortgage that was taken out on this home.
Original Mortgage
$382,500
Interest Rate
5.81%
Mortgage Type
Purchase Money Mortgage
Purchase Details
Closed on
Apr 6, 2001
Sold by
Santagada Rose A
Bought by
Santagada Rose A and Santagada Peter
Create a Home Valuation Report for This Property
The Home Valuation Report is an in-depth analysis detailing your home's value as well as a comparison with similar homes in the area
Home Values in the Area
Average Home Value in this Area
Purchase History
| Date | Buyer | Sale Price | Title Company |
|---|---|---|---|
| Syku Joseph | $405,600 | -- | |
| Syku Joseph | $405,600 | -- | |
| Tinaj Anton | $405,000 | -- | |
| Tinaj Anton | $405,000 | -- | |
| U S Bank National Association As Trust | $528,228 | -- | |
| U S Bank National Association As Trust | $528,228 | -- | |
| Santagada Peter | -- | -- | |
| Santagada Peter | -- | -- | |
| Santagada Peter | -- | -- | |
| Santagada Peter | -- | -- | |
| Santagada Rose A | -- | First American | |
| Santagada Rose A | -- | First American |
Source: Public Records
Mortgage History
| Date | Status | Borrower | Loan Amount |
|---|---|---|---|
| Previous Owner | Santagada Peter | $382,500 |
Source: Public Records
Tax History Compared to Growth
Tax History
| Year | Tax Paid | Tax Assessment Tax Assessment Total Assessment is a certain percentage of the fair market value that is determined by local assessors to be the total taxable value of land and additions on the property. | Land | Improvement |
|---|---|---|---|---|
| 2025 | $8,267 | $41,472 | $6,761 | $34,711 |
| 2024 | $8,267 | $41,159 | $7,009 | $34,150 |
| 2023 | $7,886 | $38,831 | $7,618 | $31,213 |
| 2022 | $7,313 | $54,180 | $9,840 | $44,340 |
| 2021 | $7,273 | $49,860 | $9,840 | $40,020 |
| 2020 | $7,315 | $43,140 | $9,840 | $33,300 |
| 2019 | $7,175 | $39,480 | $9,840 | $29,640 |
| 2018 | $6,596 | $32,359 | $9,229 | $23,130 |
| 2017 | $6,223 | $30,528 | $9,647 | $20,881 |
| 2016 | $5,757 | $28,800 | $7,859 | $20,941 |
| 2015 | $3,473 | $28,800 | $9,410 | $19,390 |
| 2014 | $3,473 | $28,583 | $9,580 | $19,003 |
Source: Public Records
Map
Nearby Homes
- 1636 Williamsbridge Rd
- 1629 Haight Ave
- 1633 Lurting Ave
- 1633 Tenbroeck Ave
- 1818 Tomlinson Ave
- 1610 Hering Ave
- 1639 Hone Ave
- 1819 Haight Ave
- 1725 Hone Ave
- 1617 Hone Ave
- 1720A Paulding Ave
- 1846 Williamsbridge Rd
- 1855 Williamsbridge Rd
- 1863 Williamsbridge Rd
- 1570 Paulding Ave
- 1116 Rhinelander Ave
- 1861 Hering Ave
- 1570 Colden Ave
- 1630 Radcliff Ave
- 1831 Paulding Ave
- 1654 Tomlinson Ave
- 1658 Tomlinson Ave
- 1652 Tomlinson Ave
- 1662 Tomlinson Ave Unit 1
- 1662 Tomlinson Ave Unit 2
- 1650 Tomlinson Ave
- 1671 Williamsbridge Rd
- 1669 Williamsbridge Rd
- 1664 Tomlinson Ave
- 1673 Williamsbridge Rd
- 1667 Williamsbridge Rd
- 1675 Williamsbridge Rd
- 1665 Williamsbridge Rd
- 1677 Williamsbridge Rd
- 1663 Williamsbridge Rd
- 1646 Tomlinson Ave
- 1679 Williamsbridge Rd
- 1661 Williamsbridge Rd
- 1659 Tomlinson Ave
- 1657 Tomlinson Ave