Estimated Value: $146,000 - $165,000
3
Beds
1
Bath
864
Sq Ft
$182/Sq Ft
Est. Value
About This Home
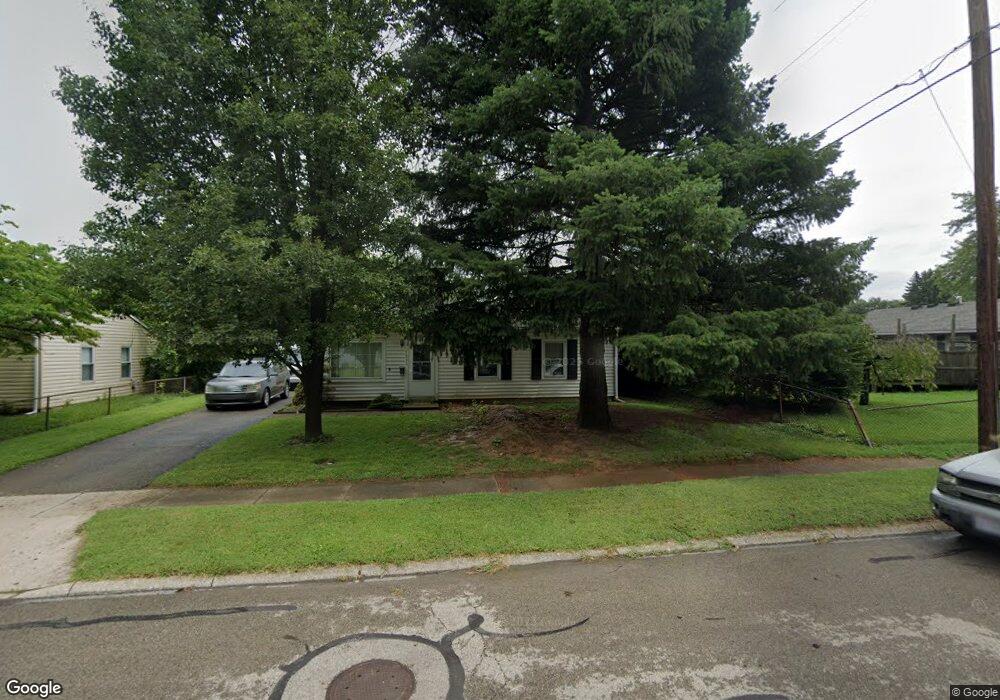
This home is located at 1657 Bowman Dr, Xenia, OH 45385 and is currently estimated at $157,336, approximately $182 per square foot. 1657 Bowman Dr is a home located in Greene County with nearby schools including Xenia High School, Summit Academy Community School for Alternative Learners - Xenia, and Legacy Christian Academy.
Ownership History
Date
Name
Owned For
Owner Type
Purchase Details
Closed on
Dec 26, 2006
Sold by
Cline Dana W and Cline Amy N
Bought by
Clelland Eric A
Current Estimated Value
Home Financials for this Owner
Home Financials are based on the most recent Mortgage that was taken out on this home.
Original Mortgage
$81,725
Outstanding Balance
$49,001
Interest Rate
6.27%
Mortgage Type
Unknown
Estimated Equity
$108,335
Purchase Details
Closed on
Oct 26, 1998
Sold by
Estate Of James R Moser
Bought by
Moser Mildred K
Home Financials for this Owner
Home Financials are based on the most recent Mortgage that was taken out on this home.
Original Mortgage
$61,000
Interest Rate
6.68%
Purchase Details
Closed on
Oct 24, 1998
Sold by
Moser Mildred K
Bought by
Cline Dana W and Cline Amy N
Home Financials for this Owner
Home Financials are based on the most recent Mortgage that was taken out on this home.
Original Mortgage
$61,000
Interest Rate
6.68%
Create a Home Valuation Report for This Property
The Home Valuation Report is an in-depth analysis detailing your home's value as well as a comparison with similar homes in the area
Home Values in the Area
Average Home Value in this Area
Purchase History
| Date | Buyer | Sale Price | Title Company |
|---|---|---|---|
| Clelland Eric A | $81,900 | Attorney | |
| Moser Mildred K | -- | -- | |
| Cline Dana W | $61,500 | -- |
Source: Public Records
Mortgage History
| Date | Status | Borrower | Loan Amount |
|---|---|---|---|
| Open | Clelland Eric A | $81,725 | |
| Previous Owner | Cline Dana W | $61,000 |
Source: Public Records
Tax History Compared to Growth
Tax History
| Year | Tax Paid | Tax Assessment Tax Assessment Total Assessment is a certain percentage of the fair market value that is determined by local assessors to be the total taxable value of land and additions on the property. | Land | Improvement |
|---|---|---|---|---|
| 2024 | $1,444 | $34,640 | $9,890 | $24,750 |
| 2023 | $1,444 | $34,640 | $9,890 | $24,750 |
| 2022 | $1,196 | $24,450 | $7,060 | $17,390 |
| 2021 | $1,212 | $24,450 | $7,060 | $17,390 |
| 2020 | $1,160 | $24,450 | $7,060 | $17,390 |
| 2019 | $1,055 | $20,930 | $4,720 | $16,210 |
| 2018 | $1,059 | $20,930 | $4,720 | $16,210 |
| 2017 | $1,014 | $20,930 | $4,720 | $16,210 |
| 2016 | $1,015 | $19,690 | $4,720 | $14,970 |
| 2015 | $1,017 | $19,690 | $4,720 | $14,970 |
| 2014 | $973 | $19,690 | $4,720 | $14,970 |
Source: Public Records
Map
Nearby Homes
- 121 S Progress Dr
- 1391 June Dr
- 1342 Kylemore Dr
- 1283 June Dr
- 1233 June Dr
- 1223 June Dr
- 1144 Rockwell Dr
- 1568 Cheyenne Dr
- 1351 Omard Dr
- 343 Sheelin Rd
- 1618 Navajo Dr
- 1653 Seneca Dr
- 161 Montana Dr
- 2758 Wyoming Dr
- 912 Omard Dr
- 1208 Bellbrook Ave
- 883 Omard Dr
- 1272 Bellbrook Ave
- 219 Kansas Dr
- 509 Antrim Rd
- 1671 Bowman Dr
- 144 Ridgebury Dr
- 128 Ridgebury Dr
- 1624 Rockwell Dr
- 1683 Bowman Dr
- 1638 Rockwell Dr
- 114 Ridgebury Dr
- 1658 Bowman Dr
- 1658 Bowman Dr Unit 2B
- 172 Ridgebury Dr
- 1650 Rockwell Dr
- 1670 Bowman Dr
- 1695 Bowman Dr
- 1684 Bowman Dr
- 1664 Rockwell Dr
- 184 Ridgebury Dr
- 147 Ridgebury Dr
- 133 Ridgebury Dr
- 1696 Bowman Dr
- 1709 Bowman Dr