Estimated Value: $377,000 - $490,000
3
Beds
2
Baths
2,054
Sq Ft
$211/Sq Ft
Est. Value
About This Home
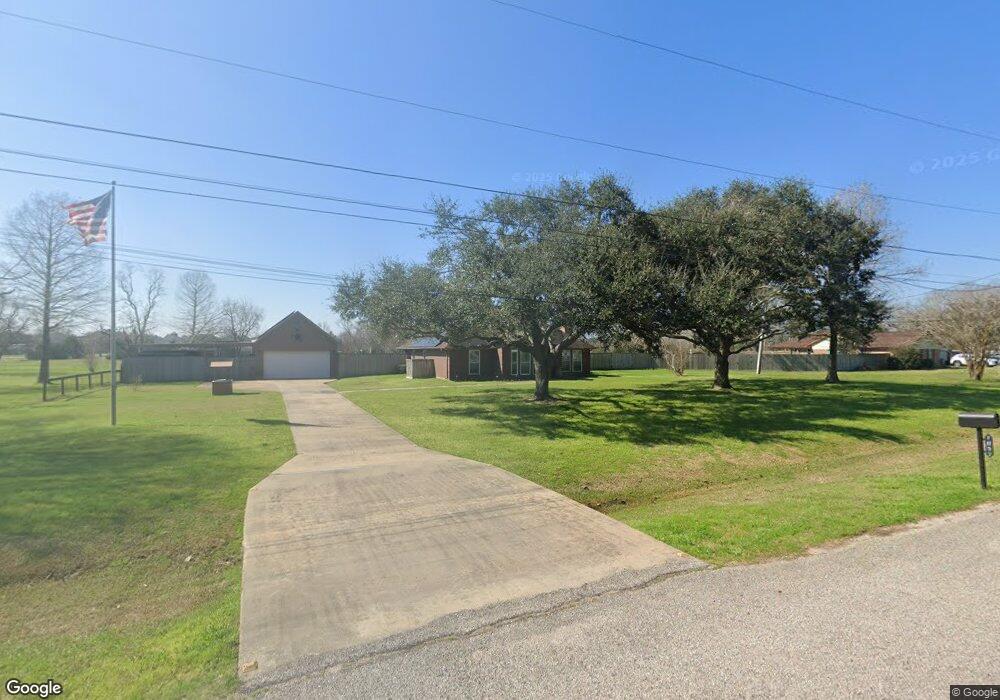
This home is located at 1657 County Road 965, Alvin, TX 77511 and is currently estimated at $433,934, approximately $211 per square foot. 1657 County Road 965 is a home located in Brazoria County with nearby schools including Hood-Case Elementary School, G.W. Harby Junior High School, and Alvin High School.
Ownership History
Date
Name
Owned For
Owner Type
Purchase Details
Closed on
Nov 24, 2010
Sold by
Fairweather Wendi K and Brown Patrick
Bought by
Marbach Byron and Marbach Bonnie
Current Estimated Value
Home Financials for this Owner
Home Financials are based on the most recent Mortgage that was taken out on this home.
Original Mortgage
$194,000
Outstanding Balance
$127,672
Interest Rate
4.22%
Mortgage Type
New Conventional
Estimated Equity
$306,262
Purchase Details
Closed on
Aug 20, 2008
Sold by
Porter Cecil Randy and Porter Valerie
Bought by
Fairweather Wendi K
Home Financials for this Owner
Home Financials are based on the most recent Mortgage that was taken out on this home.
Original Mortgage
$195,000
Interest Rate
6.42%
Mortgage Type
Purchase Money Mortgage
Create a Home Valuation Report for This Property
The Home Valuation Report is an in-depth analysis detailing your home's value as well as a comparison with similar homes in the area
Home Values in the Area
Average Home Value in this Area
Purchase History
| Date | Buyer | Sale Price | Title Company |
|---|---|---|---|
| Marbach Byron | -- | Chicago Title Friendswood | |
| Fairweather Wendi K | -- | Multiple |
Source: Public Records
Mortgage History
| Date | Status | Borrower | Loan Amount |
|---|---|---|---|
| Open | Marbach Byron | $194,000 | |
| Previous Owner | Fairweather Wendi K | $195,000 |
Source: Public Records
Tax History Compared to Growth
Tax History
| Year | Tax Paid | Tax Assessment Tax Assessment Total Assessment is a certain percentage of the fair market value that is determined by local assessors to be the total taxable value of land and additions on the property. | Land | Improvement |
|---|---|---|---|---|
| 2025 | $5,392 | $408,722 | $111,310 | $313,970 |
| 2023 | $5,392 | $332,750 | $111,310 | $295,472 |
| 2022 | $6,445 | $302,500 | $59,950 | $273,230 |
| 2021 | $6,102 | $275,000 | $26,190 | $248,810 |
| 2020 | $5,834 | $272,630 | $17,460 | $255,170 |
| 2019 | $5,460 | $235,850 | $17,460 | $218,390 |
| 2018 | $5,375 | $233,290 | $17,460 | $215,830 |
| 2017 | $4,945 | $210,520 | $17,460 | $193,060 |
| 2016 | $5,576 | $237,370 | $22,700 | $214,670 |
| 2015 | $4,506 | $236,760 | $17,460 | $219,300 |
| 2014 | $4,506 | $210,990 | $17,460 | $193,530 |
Source: Public Records
Map
Nearby Homes
- 1695 County Road 965
- 1690 County Road 965
- 2257 County Road 529
- 1236 County Road 634
- 1513 County Road 149
- 1871 County Road 936
- 0 Cardinal Dr
- 1688 County Road 144
- 3046 County Road 529
- 1259 County Road 147
- 1816 County Road 936b
- 1290 County Road 145
- 1153 County Road 150
- 2518 W Highway 6
- 3245 W Highway 6
- 925 County Road 737b
- 1663 Morgan Trail Dr
- 1494 Foshee Ct
- 1480 Foshee Ct
- 1025 Luke Dr
- 1679 County Road 965
- 1649 County Road 965
- 1662 County Road 965
- 1638 County Road 965
- 1674 County Road 965
- 1641 County Road 965
- 1209 County Road 634
- 1626 County Road 965
- 1637 County Road 965
- 1189 County Road 634
- 0 County Road 965 Unit 92221954
- 132 Woodridge Cir
- 1699 County Road 965
- 1734 County Road 965
- 1223 County Road 634
- 2363 County Road 529
- 1192 County Road 634
- 2399 County Road 529
- 1701 County Road 965
- 1717 County Road 965