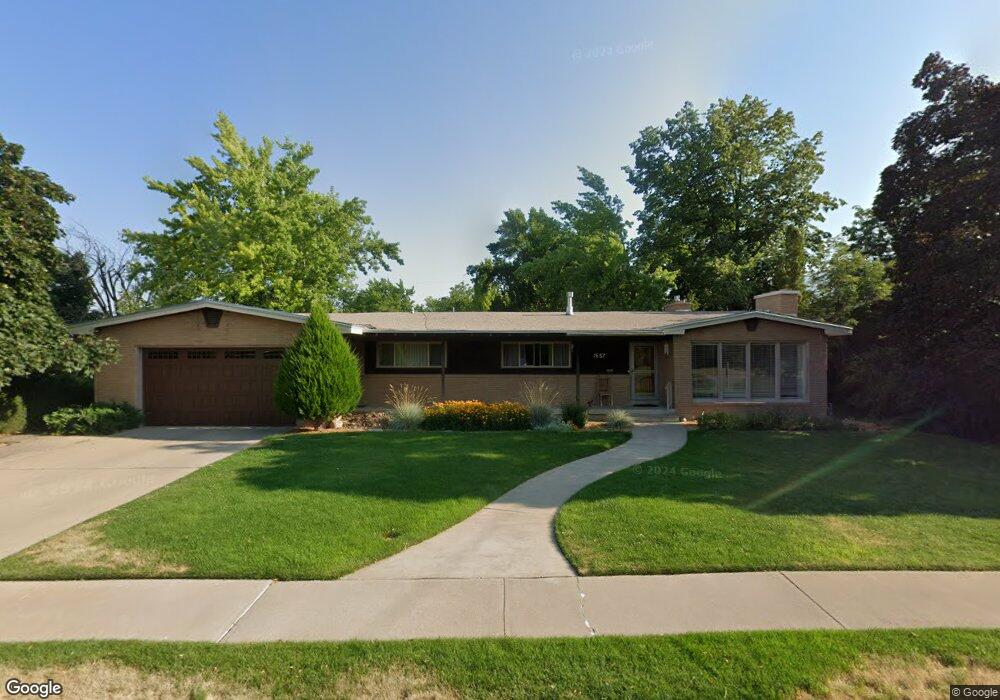
1657 E 1140 N Logan, UT 84341
Hillcrest NeighborhoodEstimated Value: $537,000 - $607,000
4
Beds
3
Baths
3,514
Sq Ft
$160/Sq Ft
Est. Value
About This Home
This home is located at 1657 E 1140 N, Logan, UT 84341 and is currently estimated at $561,653, approximately $159 per square foot. 1657 E 1140 N is a home located in Cache County with nearby schools including Hillcrest Elementary School, Mount Logan Middle School, and Logan High School.
Ownership History
Date
Name
Owned For
Owner Type
Purchase Details
Closed on
Jun 12, 2024
Sold by
Corbridge Douglas K and Corbridge Sophia
Bought by
Doug & Sophia Corbridge Family Revocable Trus and Corbridge
Current Estimated Value
Purchase Details
Closed on
Feb 20, 2015
Sold by
Nielson Reed L
Bought by
Corbridge Douglas K and Corbridge Sophia
Home Financials for this Owner
Home Financials are based on the most recent Mortgage that was taken out on this home.
Original Mortgage
$136,450
Interest Rate
3.6%
Mortgage Type
New Conventional
Purchase Details
Closed on
Jan 19, 2010
Sold by
Nielson Betty E and Nielson Reed L
Bought by
Nielson Reed L and Nielson Betty E
Create a Home Valuation Report for This Property
The Home Valuation Report is an in-depth analysis detailing your home's value as well as a comparison with similar homes in the area
Home Values in the Area
Average Home Value in this Area
Purchase History
| Date | Buyer | Sale Price | Title Company |
|---|---|---|---|
| Doug & Sophia Corbridge Family Revocable Trus | -- | None Listed On Document | |
| Corbridge Douglas K | -- | Advanced Title | |
| Nielson Reed L | -- | None Available |
Source: Public Records
Mortgage History
| Date | Status | Borrower | Loan Amount |
|---|---|---|---|
| Previous Owner | Corbridge Douglas K | $136,450 |
Source: Public Records
Tax History
| Year | Tax Paid | Tax Assessment Tax Assessment Total Assessment is a certain percentage of the fair market value that is determined by local assessors to be the total taxable value of land and additions on the property. | Land | Improvement |
|---|---|---|---|---|
| 2025 | $2,220 | $287,140 | $0 | $0 |
| 2024 | $2,292 | $287,140 | $0 | $0 |
| 2023 | $2,391 | $285,490 | $0 | $0 |
| 2022 | $2,191 | $244,240 | $0 | $0 |
| 2021 | $202 | $348,390 | $75,000 | $273,390 |
| 2020 | $1,840 | $285,300 | $75,000 | $210,300 |
| 2019 | $1,923 | $285,300 | $75,000 | $210,300 |
| 2018 | $1,962 | $265,736 | $75,000 | $190,736 |
| 2017 | $1,731 | $123,915 | $0 | $0 |
| 2016 | $1,794 | $123,915 | $0 | $0 |
| 2015 | $1,796 | $123,915 | $0 | $0 |
| 2014 | $1,624 | $123,915 | $0 | $0 |
| 2013 | -- | $104,050 | $0 | $0 |
Source: Public Records
Map
Nearby Homes
- 1133 N 1520 E
- 1782 E 1250 N
- 1512 E 1260 N
- 1535 E 1385 N
- 1440 N 1600 E
- 1357 E 1220 N
- 1450 N 1525 E
- 1405 N Aspen Dr
- 1454 N 1400 E
- 825 N 1400 E
- 1451 N Aspen Dr
- 866 Hillcrest Ave
- 1354 N 1250 E Unit 46
- 1475 N Aspen Dr Unit 16
- 1336 E Talmage Ln Unit 38
- 1341 N 1250 E Unit 41
- 1374 N 1250 E Unit 48
- 1902 E 1500 N
- 1374 Maple Dr
- 1586 N Sharptail Cir
Your Personal Tour Guide
Ask me questions while you tour the home.