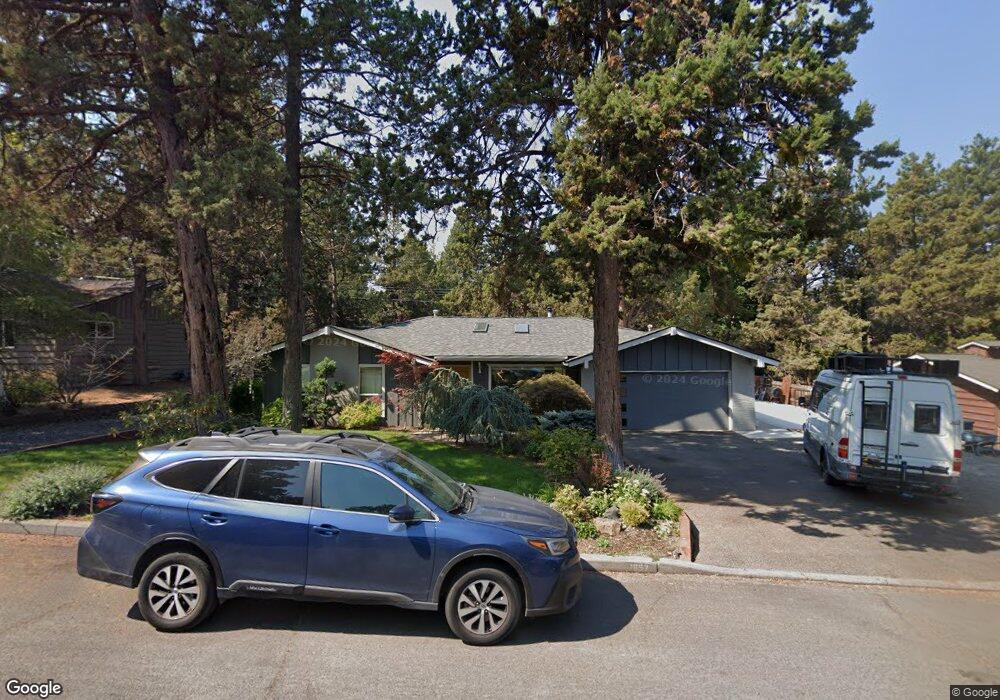
1657 NE 13th St Bend, OR 97701
Orchard District NeighborhoodEstimated Value: $617,000 - $715,000
3
Beds
2
Baths
1,843
Sq Ft
$360/Sq Ft
Est. Value
About This Home
This home is located at 1657 NE 13th St, Bend, OR 97701 and is currently estimated at $663,118, approximately $359 per square foot. 1657 NE 13th St is a home located in Deschutes County with nearby schools including Juniper Elementary School, Bend Senior High School, and The Waldorf School of Bend.
Ownership History
Date
Name
Owned For
Owner Type
Purchase Details
Closed on
Jun 4, 2020
Sold by
Sipes Colleen R and Sipes Johnson Colleen
Bought by
Sipes Johnson Colleen R and Johnson Matthew
Current Estimated Value
Home Financials for this Owner
Home Financials are based on the most recent Mortgage that was taken out on this home.
Original Mortgage
$233,000
Outstanding Balance
$205,622
Interest Rate
3.2%
Mortgage Type
New Conventional
Estimated Equity
$457,496
Purchase Details
Closed on
Mar 4, 2015
Sold by
Martin Kathleen D
Bought by
Sipes Colleen R
Home Financials for this Owner
Home Financials are based on the most recent Mortgage that was taken out on this home.
Original Mortgage
$250,800
Interest Rate
3.57%
Mortgage Type
New Conventional
Purchase Details
Closed on
Oct 2, 2012
Sold by
Martin Kathleen D
Bought by
Martin Kathleen D and 1996 Martin Family Trust
Purchase Details
Closed on
Oct 26, 2004
Sold by
Williams Tony and Williams Lisa
Bought by
Martin Raymond E and Martin Kathleen D
Create a Home Valuation Report for This Property
The Home Valuation Report is an in-depth analysis detailing your home's value as well as a comparison with similar homes in the area
Home Values in the Area
Average Home Value in this Area
Purchase History
| Date | Buyer | Sale Price | Title Company |
|---|---|---|---|
| Sipes Johnson Colleen R | -- | Servicelink | |
| Sipes Colleen R | $264,000 | First American Title | |
| Martin Kathleen D | -- | None Available | |
| Martin Raymond E | $218,000 | Amerititle |
Source: Public Records
Mortgage History
| Date | Status | Borrower | Loan Amount |
|---|---|---|---|
| Open | Sipes Johnson Colleen R | $233,000 | |
| Closed | Sipes Colleen R | $250,800 |
Source: Public Records
Tax History Compared to Growth
Tax History
| Year | Tax Paid | Tax Assessment Tax Assessment Total Assessment is a certain percentage of the fair market value that is determined by local assessors to be the total taxable value of land and additions on the property. | Land | Improvement |
|---|---|---|---|---|
| 2025 | $4,299 | $254,420 | -- | -- |
| 2024 | $4,136 | $247,010 | -- | -- |
| 2023 | $3,834 | $239,820 | $0 | $0 |
| 2022 | $3,577 | $226,060 | $0 | $0 |
| 2021 | $3,582 | $219,480 | $0 | $0 |
| 2020 | $3,399 | $219,480 | $0 | $0 |
| 2019 | $3,304 | $213,090 | $0 | $0 |
| 2018 | $3,211 | $206,890 | $0 | $0 |
| 2017 | $3,117 | $200,870 | $0 | $0 |
| 2016 | $2,972 | $195,020 | $0 | $0 |
| 2015 | $2,890 | $189,340 | $0 | $0 |
| 2014 | $2,805 | $183,830 | $0 | $0 |
Source: Public Records
Map
Nearby Homes
- 1630 NE 13th St
- 1622 NE Parkridge Dr
- 1848 NE 14th St
- 1532 NE 9th St
- 970 NE Norton Ave Unit Lot 7
- 1401 NE 10th St
- 2109 NE 11th Place
- 2170 NE 8th St
- 717 NE Olney Ct
- 748 NE Vail Ln
- 642 NE Seward Ave
- 1333 NE Dempsey Dr
- 1419 NE Lucinda Ct
- 1767 NE Lotus Dr Unit 1 and 2
- 1687 NE Lotus Dr
- 645 NE Marshall Ave
- 643 NE Marshall Ave
- 3843 NE Petrosa Ave
- 468 NE Olney Ave
- 2667 NE Jones Rd
- 1713 NE 13th St
- 1643 NE 13th St
- 1652 NE 12th St
- 1632 NE 12th St
- 1712 NE 12th St
- 1662 NE 13th St
- 1733 NE 13th St
- 1708 NE 13th St
- 1724 NE 12th St
- 1616 NE 12th St
- 1724 NE 13th St
- 1615 NE 13th St
- 1170 NE Quimby Ave
- 1233 NE Revere Ave
- 1643 NE Parkridge Dr
- 1643 NE Parkridge Dr Unit 32
- 1616 NE 13th St
- 1639 NE Parkridge Dr
- 1651 NE 12th St
- 1647 NE Parkridge Dr