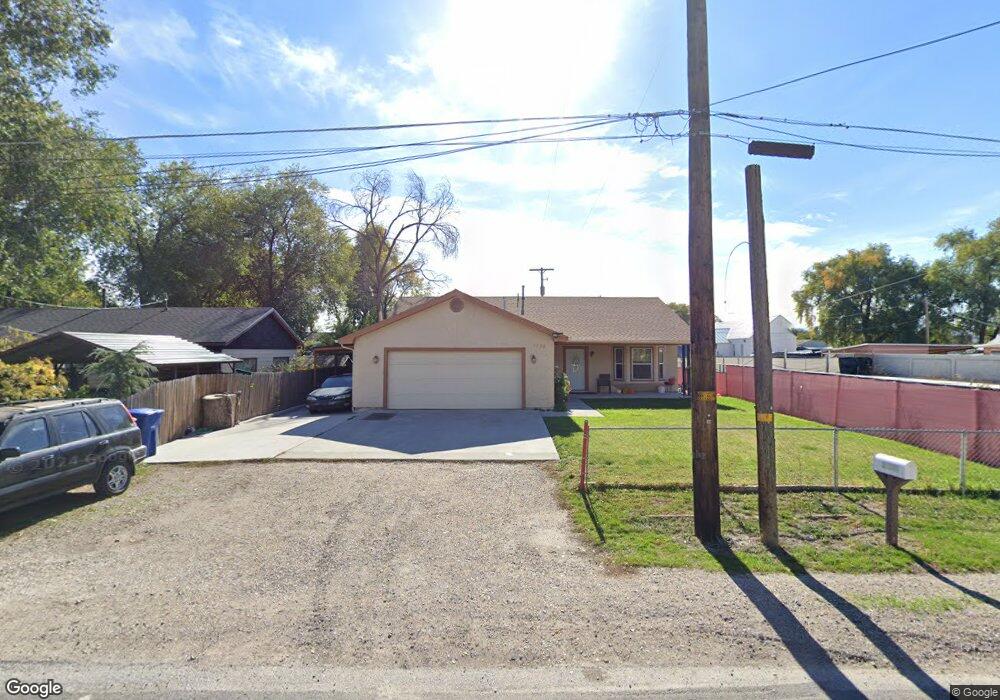
1657 W Warnock Ave Salt Lake City, UT 84119
Chesterfield NeighborhoodEstimated Value: $434,000 - $472,942
3
Beds
2
Baths
1,400
Sq Ft
$323/Sq Ft
Est. Value
About This Home
This home is located at 1657 W Warnock Ave, Salt Lake City, UT 84119 and is currently estimated at $452,736, approximately $323 per square foot. 1657 W Warnock Ave is a home located in Salt Lake County with nearby schools including Redwood Elementary School, Granite Park Jr High School, and Granger High School.
Ownership History
Date
Name
Owned For
Owner Type
Purchase Details
Closed on
Sep 19, 2023
Sold by
Mcaferee Rick A
Bought by
Mcaferee Rick A and Mcaferee Alecxander Costa
Current Estimated Value
Purchase Details
Closed on
Nov 4, 2020
Sold by
Martinez Juan Francisco Aguilar and Aguilar Evangelina Puente
Bought by
Aguilar Hugo
Home Financials for this Owner
Home Financials are based on the most recent Mortgage that was taken out on this home.
Original Mortgage
$189,000
Interest Rate
2.9%
Mortgage Type
New Conventional
Purchase Details
Closed on
Aug 24, 2016
Sold by
Judge Nathan A
Bought by
Francisco Juan and Martinez Aguilar
Home Financials for this Owner
Home Financials are based on the most recent Mortgage that was taken out on this home.
Original Mortgage
$196,910
Interest Rate
3.48%
Mortgage Type
New Conventional
Purchase Details
Closed on
Dec 14, 2009
Sold by
Judge Steve and Judge Johnnie Mae
Bought by
Jms Building Solutions
Create a Home Valuation Report for This Property
The Home Valuation Report is an in-depth analysis detailing your home's value as well as a comparison with similar homes in the area
Home Values in the Area
Average Home Value in this Area
Purchase History
| Date | Buyer | Sale Price | Title Company |
|---|---|---|---|
| Mcaferee Rick A | -- | None Listed On Document | |
| Aguilar Hugo | -- | First American Title | |
| Francisco Juan | -- | First American Title | |
| Jms Building Solutions | -- | Equity Title Insurance Agenc |
Source: Public Records
Mortgage History
| Date | Status | Borrower | Loan Amount |
|---|---|---|---|
| Previous Owner | Aguilar Hugo | $189,000 | |
| Previous Owner | Francisco Juan | $196,910 |
Source: Public Records
Tax History Compared to Growth
Tax History
| Year | Tax Paid | Tax Assessment Tax Assessment Total Assessment is a certain percentage of the fair market value that is determined by local assessors to be the total taxable value of land and additions on the property. | Land | Improvement |
|---|---|---|---|---|
| 2025 | $2,725 | $430,600 | $158,500 | $272,100 |
| 2024 | $2,725 | $417,400 | $154,400 | $263,000 |
| 2023 | $2,725 | $377,000 | $148,500 | $228,500 |
| 2022 | $2,584 | $380,100 | $132,700 | $247,400 |
| 2021 | $2,445 | $323,200 | $76,100 | $247,100 |
| 2020 | $2,204 | $275,000 | $65,000 | $210,000 |
| 2019 | $2,147 | $258,300 | $52,900 | $205,400 |
| 2018 | $1,910 | $221,500 | $52,900 | $168,600 |
| 2017 | $1,779 | $209,800 | $46,400 | $163,400 |
| 2016 | $1,597 | $188,700 | $42,400 | $146,300 |
| 2015 | $1,533 | $172,500 | $52,600 | $119,900 |
| 2014 | $1,494 | $164,700 | $50,900 | $113,800 |
Source: Public Records
Map
Nearby Homes
- 1601 W Warnock Ave
- 1603 W Warnock Ave S Unit 51
- 1670 W Crystal Ave
- 1606 W Malvern Ave
- 2346 S 1440 W Unit 2346
- 1545 W 2250 S
- 1753 W American Park Dr
- 1761 W American Park Dr
- 3032 S Independence St
- 3023 S Constitution Dr
- 1825 W Flag Ave
- 1754 W American Park Cir
- 1616 W Vivante Way Unit A7
- 1616 W Vivante Way Unit A3
- 1645 W Vivante Way Unit C1
- 1880 W 3140 S
- 2545 W 2680 S Unit 286
- 2538 W 2720 S Unit 74
- 2517 Baty Drive 2745 S Unit 183
- 3201 S Redwood Rd
- 1673 W Warnock Ave
- 1655 W Warnock Ave
- 1647 W Warnock Ave
- 1660 W Warnock Ave
- 1650 W Warnock Ave
- 1625 W Warnock Ave
- 1616 W Stratford Ave
- 1620 W Warnock Ave
- 1631 W Warnock Ave
- 2531 S Redwood Rd
- 1638 W Stratford Ave
- 1677 W Whitlock Ave
- 2521 S Redwood Rd
- 1675 W Whitlock Ave
- 1647 W Whitlock Ave
- 1614 W Warnock Ave
- 1631 W Whitlock Ave
- 1598 W Stratford Ave
- 1598 W Stratford Ave
- 1598 W Stratford Ave