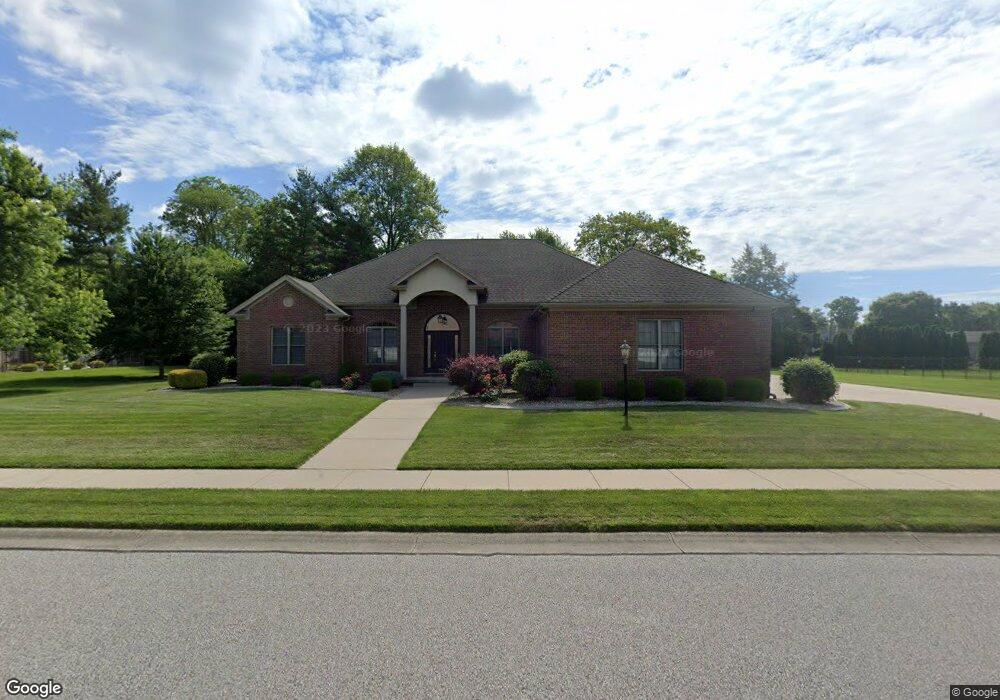
1659 Devonshire Dr Seymour, IN 47274
Estimated Value: $430,000 - $458,000
4
Beds
3
Baths
3,000
Sq Ft
$147/Sq Ft
Est. Value
About This Home
This home is located at 1659 Devonshire Dr, Seymour, IN 47274 and is currently estimated at $441,235, approximately $147 per square foot. 1659 Devonshire Dr is a home located in Jackson County with nearby schools including Emerson Elementary School, Seymour Middle School, and Seymour Senior High School.
Ownership History
Date
Name
Owned For
Owner Type
Purchase Details
Closed on
Apr 19, 2013
Sold by
Connell Victor
Bought by
Mcintosh Larry W and Mcintosh Kristina A
Current Estimated Value
Purchase Details
Closed on
Jun 22, 2009
Sold by
Schryer Kevin
Bought by
Connell Victor and Connell Carolyn
Purchase Details
Closed on
May 28, 2009
Sold by
Wayman Joe N and Wayman Connie S
Bought by
Schryer Kevin W
Purchase Details
Closed on
Aug 25, 2006
Sold by
Templeton R Douglas R and Templeton Kathy A
Bought by
Christopher Scott and Christopher Jill
Home Financials for this Owner
Home Financials are based on the most recent Mortgage that was taken out on this home.
Original Mortgage
$44,200
Interest Rate
6.77%
Mortgage Type
New Conventional
Purchase Details
Closed on
Oct 14, 2005
Sold by
Jebberwock Inc
Bought by
Templeton R Douglas R and Templeton Kathy A
Create a Home Valuation Report for This Property
The Home Valuation Report is an in-depth analysis detailing your home's value as well as a comparison with similar homes in the area
Home Values in the Area
Average Home Value in this Area
Purchase History
| Date | Buyer | Sale Price | Title Company |
|---|---|---|---|
| Mcintosh Larry W | $355,000 | -- | |
| Connell Victor | $303,300 | Smart & Johnson Title Corp | |
| Connell Victor | -- | None Available | |
| Schryer Kevin W | -- | Indiana Bank And Trust Compa | |
| Christopher Scott | -- | None Available | |
| Templeton R Douglas R | -- | None Available |
Source: Public Records
Mortgage History
| Date | Status | Borrower | Loan Amount |
|---|---|---|---|
| Previous Owner | Christopher Scott | $44,200 |
Source: Public Records
Tax History
| Year | Tax Paid | Tax Assessment Tax Assessment Total Assessment is a certain percentage of the fair market value that is determined by local assessors to be the total taxable value of land and additions on the property. | Land | Improvement |
|---|---|---|---|---|
| 2025 | $3,631 | $404,700 | $48,300 | $356,400 |
| 2024 | $3,631 | $363,100 | $48,300 | $314,800 |
| 2023 | $4,020 | $348,800 | $48,300 | $300,500 |
| 2022 | $3,879 | $345,600 | $48,300 | $297,300 |
| 2021 | $5,496 | $323,400 | $48,300 | $275,100 |
| 2020 | $3,481 | $315,600 | $48,300 | $267,300 |
| 2019 | $3,504 | $318,800 | $48,300 | $270,500 |
| 2018 | $3,301 | $308,200 | $48,300 | $259,900 |
| 2017 | $3,301 | $308,300 | $48,300 | $260,000 |
| 2016 | $2,729 | $276,500 | $48,300 | $228,200 |
| 2014 | $2,589 | $324,000 | $52,500 | $271,500 |
| 2013 | $2,589 | $319,000 | $52,700 | $266,300 |
Source: Public Records
Map
Nearby Homes
- 601 Vehslage Rd
- 595 Camelot Dr
- 597 Lasher Dr
- 1740 Bell Ford Dr
- 1720 Bell Ford Dr E
- 1716 Bell Ford Dr W
- 560 Sir Lancelot Dr
- 1452 Stadium Dr
- 1503 Stadium Dr
- 1101 North Dr
- 1519 New Ford Rd
- 660 East Dr
- 461 Western Pkwy
- 824 W 5th St
- 443 Western Pkwy
- 316 Kessler Blvd
- 3510 Killarney Ct
- 3504 Killarney Ct
- 3502 Killarney Ct
- 3514 Killarney Ct
- 1655 Devonshire Dr
- 1663 Devonshire Dr
- 595 Vehslage Rd
- 1660 Devonshire Dr
- 1656 Devonshire Dr
- 1651 Devonshire Dr
- 593 Vehslage Rd
- 1664 Devonshire Dr
- 1667 Devonshire Dr
- 1652 Devonshire Dr
- 1632 Windsor Ct
- 6921 E State Road 258
- 1680 Devonshire Dr
- 1679 Devonshire Dr
- 596 Vehslage Rd
- 598 Vehslage Rd
- 1636 Windsor Ct
- 594 Vehslage Rd
- 592 Vehslage Rd
- 1628 Windsor Ct
Your Personal Tour Guide
Ask me questions while you tour the home.