Estimated Value: $210,083 - $246,000
3
Beds
2
Baths
1,368
Sq Ft
$166/Sq Ft
Est. Value
About This Home
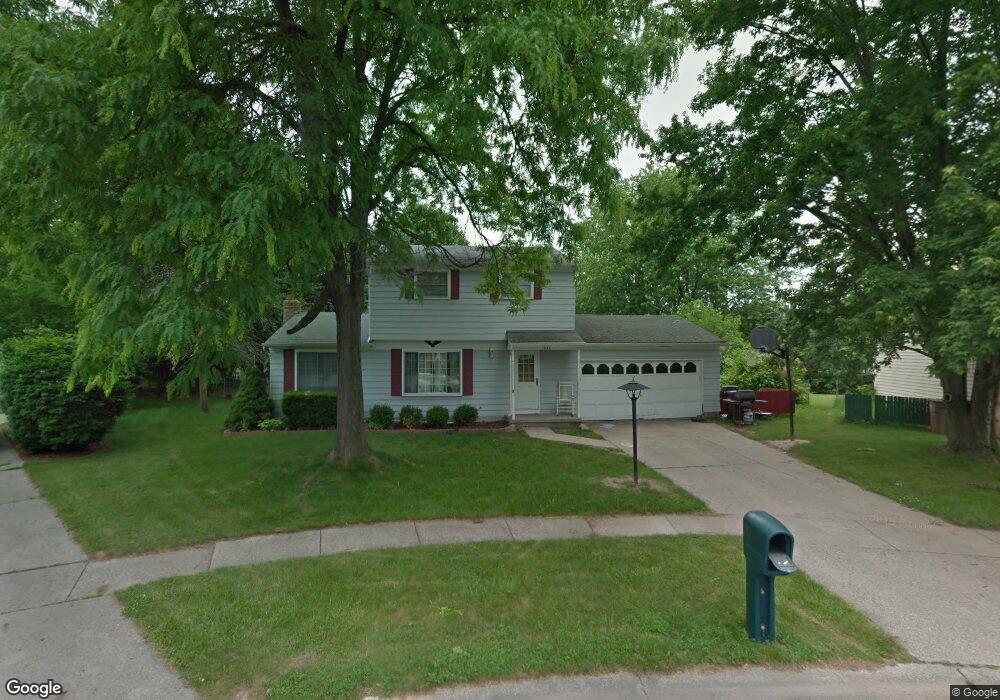
This home is located at 1659 Pearson Ct, Holt, MI 48842 and is currently estimated at $226,521, approximately $165 per square foot. 1659 Pearson Ct is a home located in Ingham County with nearby schools including Sycamore Elementary School, Holt Junior High School, and Hope Middle School.
Ownership History
Date
Name
Owned For
Owner Type
Purchase Details
Closed on
May 23, 2021
Sold by
Evans Robert L
Bought by
Evans Robert L and Evans Kelly
Current Estimated Value
Home Financials for this Owner
Home Financials are based on the most recent Mortgage that was taken out on this home.
Original Mortgage
$149,570
Outstanding Balance
$135,122
Interest Rate
2.9%
Mortgage Type
New Conventional
Estimated Equity
$91,399
Purchase Details
Closed on
Oct 6, 2005
Sold by
Smith Josiah and Smith Melissa A
Bought by
Evans Robert L
Home Financials for this Owner
Home Financials are based on the most recent Mortgage that was taken out on this home.
Original Mortgage
$157,888
Interest Rate
5.82%
Mortgage Type
VA
Purchase Details
Closed on
Nov 13, 2001
Sold by
Souza Peter and Souza Barbara R
Bought by
Smith Josiah and Smith Melissa A
Home Financials for this Owner
Home Financials are based on the most recent Mortgage that was taken out on this home.
Original Mortgage
$130,000
Interest Rate
6.68%
Mortgage Type
Purchase Money Mortgage
Create a Home Valuation Report for This Property
The Home Valuation Report is an in-depth analysis detailing your home's value as well as a comparison with similar homes in the area
Home Values in the Area
Average Home Value in this Area
Purchase History
| Date | Buyer | Sale Price | Title Company |
|---|---|---|---|
| Evans Robert L | -- | Madison Settlement Svcs Llc | |
| Evans Robert L | $157,888 | Tnt | |
| Smith Josiah | $136,900 | First American Title Ins Co |
Source: Public Records
Mortgage History
| Date | Status | Borrower | Loan Amount |
|---|---|---|---|
| Open | Evans Robert L | $149,570 | |
| Closed | Evans Robert L | $157,888 | |
| Previous Owner | Smith Josiah | $130,000 |
Source: Public Records
Tax History
| Year | Tax Paid | Tax Assessment Tax Assessment Total Assessment is a certain percentage of the fair market value that is determined by local assessors to be the total taxable value of land and additions on the property. | Land | Improvement |
|---|---|---|---|---|
| 2025 | $4,595 | $96,700 | $25,000 | $71,700 |
| 2024 | $9 | $90,300 | $25,000 | $65,300 |
| 2023 | $4,337 | $81,600 | $18,500 | $63,100 |
| 2022 | $4,160 | $75,900 | $18,500 | $57,400 |
| 2021 | $4,173 | $69,700 | $14,200 | $55,500 |
| 2020 | $4,124 | $65,900 | $14,200 | $51,700 |
| 2019 | $3,961 | $60,600 | $12,800 | $47,800 |
| 2018 | $3,944 | $59,700 | $12,800 | $46,900 |
| 2017 | $3,807 | $59,700 | $12,800 | $46,900 |
| 2016 | $3,817 | $58,900 | $12,500 | $46,400 |
| 2015 | $3,629 | $55,200 | $25,000 | $30,200 |
| 2014 | $3,629 | $55,200 | $25,000 | $30,200 |
Source: Public Records
Map
Nearby Homes
- 1761 Schoolcraft St
- 0 Aurelius Rd Unit 282659
- 1942 Walnut St
- 1959 Adelpha Ave
- 4592 Holt Rd
- 4360 Holt Rd Unit 9
- 1219 Wildflower Dr
- 2028 Auburn Ave
- 4282 Woodworth Ave
- 2122 Cedar St
- 4108 Holt Rd
- 1532 N Eifert Rd
- 2201 Bertha St
- 2201 N Aurelius Rd
- 5040 Runnymede Dr
- 4942 Holt Rd
- 5071 Haddon Hall Dr
- 4641 Tolland Ave
- 5091 Runnymede Dr
- 4662 Tolland Ave
- 1653 Pearson Ct
- 1654 Grayfriars Ave
- 1660 Grayfriars Ave
- 1655 Pearson Ct
- 1648 Grayfriars Ave
- 1666 Grayfriars Ave
- 4655 Eastlund Cir
- 4645 Eastlund Cir
- 1642 Grayfriars Ave
- 1654 Pearson Ct
- 1660 Pearson Ct
- 1552 Thimbleberry Ln
- 1540 Thimbleberry Ln
- 1530 Thimbleberry Ln
- 1636 Grayfriars Ave
- 1668 Pearson Ct
- 1655 Grayfriars Ave
- 1661 Grayfriars Ave
- 4430 Doncaster Ave
- 1649 Grayfriars Ave
Your Personal Tour Guide
Ask me questions while you tour the home.