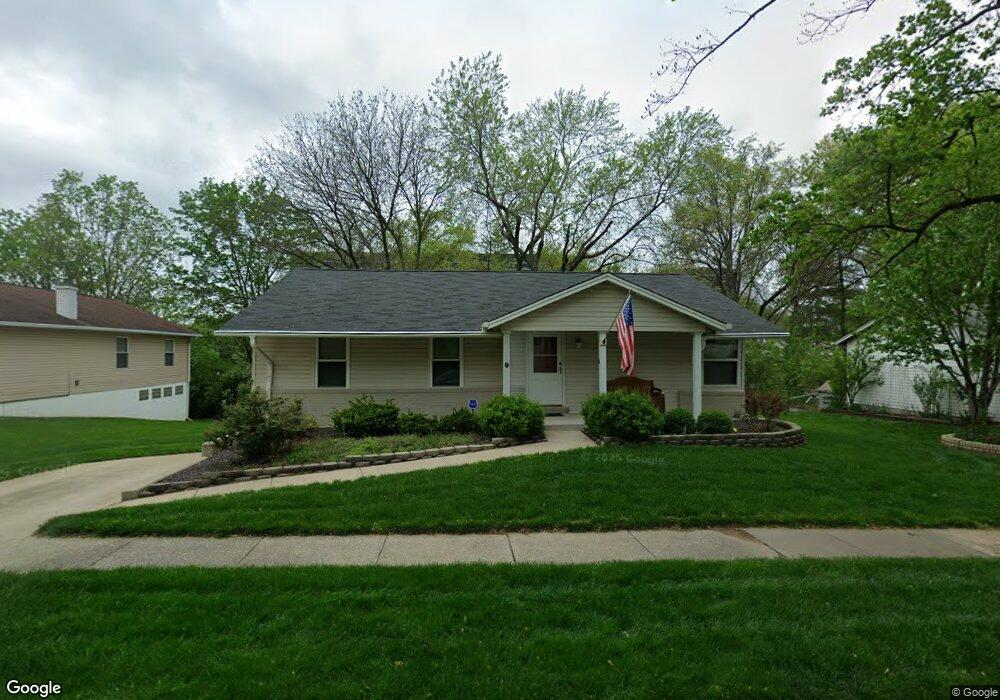
1659 Prestonpark Ln Saint Louis, MO 63146
Estimated Value: $269,885 - $385,000
3
Beds
2
Baths
1,247
Sq Ft
$257/Sq Ft
Est. Value
About This Home
This home is located at 1659 Prestonpark Ln, Saint Louis, MO 63146 and is currently estimated at $319,971, approximately $256 per square foot. 1659 Prestonpark Ln is a home located in St. Louis County with nearby schools including Craig Elementary School, Parkway Northeast Middle School, and Parkway North High School.
Ownership History
Date
Name
Owned For
Owner Type
Purchase Details
Closed on
Nov 17, 1999
Sold by
Ridgemoor Investments Inc
Bought by
Stuhlmann Douglas and Stuhlmann Elizabeth E
Current Estimated Value
Home Financials for this Owner
Home Financials are based on the most recent Mortgage that was taken out on this home.
Original Mortgage
$102,600
Outstanding Balance
$29,816
Interest Rate
7.12%
Estimated Equity
$290,155
Purchase Details
Closed on
Nov 5, 1999
Sold by
Oconnor Joseph P and Oconnor Mary T
Bought by
Wang Shelly J S
Home Financials for this Owner
Home Financials are based on the most recent Mortgage that was taken out on this home.
Original Mortgage
$102,600
Outstanding Balance
$29,816
Interest Rate
7.12%
Estimated Equity
$290,155
Purchase Details
Closed on
Nov 1, 1999
Sold by
Reynolds Paul A
Bought by
Bartlett Nathan G
Home Financials for this Owner
Home Financials are based on the most recent Mortgage that was taken out on this home.
Original Mortgage
$102,600
Outstanding Balance
$29,816
Interest Rate
7.12%
Estimated Equity
$290,155
Create a Home Valuation Report for This Property
The Home Valuation Report is an in-depth analysis detailing your home's value as well as a comparison with similar homes in the area
Home Values in the Area
Average Home Value in this Area
Purchase History
| Date | Buyer | Sale Price | Title Company |
|---|---|---|---|
| Stuhlmann Douglas | -- | -- | |
| Wang Shelly J S | $389,900 | -- | |
| Bartlett Nathan G | $114,000 | Capital Title |
Source: Public Records
Mortgage History
| Date | Status | Borrower | Loan Amount |
|---|---|---|---|
| Open | Bartlett Nathan G | $102,600 |
Source: Public Records
Tax History Compared to Growth
Tax History
| Year | Tax Paid | Tax Assessment Tax Assessment Total Assessment is a certain percentage of the fair market value that is determined by local assessors to be the total taxable value of land and additions on the property. | Land | Improvement |
|---|---|---|---|---|
| 2025 | $2,750 | $48,090 | $28,540 | $19,550 |
| 2024 | $2,750 | $41,900 | $19,020 | $22,880 |
| 2023 | $2,715 | $41,900 | $19,020 | $22,880 |
| 2022 | $2,507 | $35,250 | $19,020 | $16,230 |
| 2021 | $2,490 | $35,250 | $19,020 | $16,230 |
| 2020 | $2,325 | $31,410 | $18,830 | $12,580 |
| 2019 | $2,288 | $31,410 | $18,830 | $12,580 |
| 2018 | $2,177 | $27,570 | $15,850 | $11,720 |
| 2017 | $2,161 | $27,570 | $15,850 | $11,720 |
| 2016 | $2,312 | $28,080 | $12,690 | $15,390 |
| 2015 | $2,410 | $28,080 | $12,690 | $15,390 |
| 2014 | $1,813 | $22,500 | $7,320 | $15,180 |
Source: Public Records
Map
Nearby Homes
- 12167 Plainsman Dr
- 12371 Sparrowhawk Ct
- 1529 Tryon Dr
- 12314 Rossridge Ct
- 11983 Villa Dorado Dr Unit 211
- 11921 Villa Dorado Dr Unit A
- 11861 Spruce Orchard Dr
- 12045 Bridal Shire Ct
- 12558 Westport Dr
- 11825 Villa Dorado Dr
- 1425 Craig Rd
- 12558 Pepperwood Dr
- 1226 Hyannis Dr
- 11741 Casa Grande Dr Unit G
- 11714 Casa Grande Dr
- 1351 Orchard View Dr
- 1072 King Carey Dr
- 12516 Starspur Ln
- 2021 Maryland Oaks Cir
- 1033 Mackinac Dr
- 1665 Prestonpark Ln
- 1653 Prestonpark Ln
- 1671 Prestonpark Ln
- 1645 Prestonpark Ln
- 1658 Prestonpark Ln
- 1662 Prestonpark Ln
- 1666 Prestonpark Ln
- 1650 Prestonpark Ln
- 1679 Prestonpark Ln
- 1639 Prestonpark Ln
- 1644 Prestonpark Ln
- 12146 Greenwalk Dr
- 12142 Greenwalk Dr
- 1685 Prestonpark Ln
- 1633 Prestonpark Ln
- 12150 Greenwalk Dr
- 12138 Greenwalk Dr
- 1632 Prestonpark Ln
- 1691 Prestonpark Ln
- 1627 Prestonpark Ln