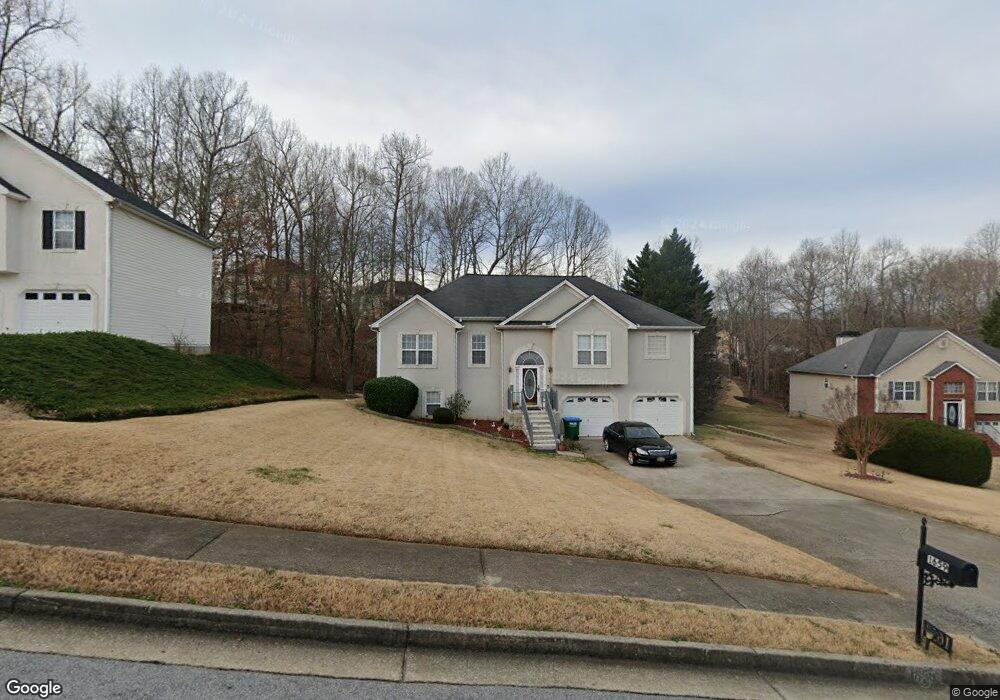
1659 Sloping Tree Way Unit 6 Lithia Springs, GA 30122
Lithia Springs NeighborhoodEstimated Value: $271,000 - $310,000
3
Beds
2
Baths
1,530
Sq Ft
$190/Sq Ft
Est. Value
About This Home
This home is located at 1659 Sloping Tree Way Unit 6, Lithia Springs, GA 30122 and is currently estimated at $291,256, approximately $190 per square foot. 1659 Sloping Tree Way Unit 6 is a home located in Douglas County with nearby schools including Sweetwater Elementary School, Turner Middle School, and Lithia Springs Comprehensive High School.
Ownership History
Date
Name
Owned For
Owner Type
Purchase Details
Closed on
Jan 27, 2020
Sold by
Martin Rodney A
Bought by
Martin Debbie M
Current Estimated Value
Purchase Details
Closed on
May 20, 1998
Sold by
Apex Homes Inc
Bought by
Martin Rodney A
Home Financials for this Owner
Home Financials are based on the most recent Mortgage that was taken out on this home.
Original Mortgage
$115,920
Interest Rate
10.6%
Mortgage Type
New Conventional
Purchase Details
Closed on
Jan 26, 1998
Sold by
Exxell Devel
Bought by
Apex Homes
Home Financials for this Owner
Home Financials are based on the most recent Mortgage that was taken out on this home.
Original Mortgage
$98,850
Interest Rate
6.86%
Mortgage Type
New Conventional
Create a Home Valuation Report for This Property
The Home Valuation Report is an in-depth analysis detailing your home's value as well as a comparison with similar homes in the area
Home Values in the Area
Average Home Value in this Area
Purchase History
| Date | Buyer | Sale Price | Title Company |
|---|---|---|---|
| Martin Debbie M | -- | -- | |
| Martin Rodney A | $128,800 | -- | |
| Apex Homes | $27,400 | -- |
Source: Public Records
Mortgage History
| Date | Status | Borrower | Loan Amount |
|---|---|---|---|
| Previous Owner | Martin Rodney A | $115,920 | |
| Previous Owner | Apex Homes | $98,850 |
Source: Public Records
Tax History Compared to Growth
Tax History
| Year | Tax Paid | Tax Assessment Tax Assessment Total Assessment is a certain percentage of the fair market value that is determined by local assessors to be the total taxable value of land and additions on the property. | Land | Improvement |
|---|---|---|---|---|
| 2024 | $2,869 | $111,920 | $24,000 | $87,920 |
| 2023 | $2,869 | $111,920 | $24,000 | $87,920 |
| 2022 | $2,696 | $98,600 | $20,000 | $78,600 |
| 2021 | $2,190 | $75,760 | $17,600 | $58,160 |
| 2020 | $2,009 | $65,400 | $11,320 | $54,080 |
| 2019 | $1,855 | $63,320 | $11,320 | $52,000 |
| 2018 | $1,832 | $61,800 | $11,320 | $50,480 |
| 2017 | $1,788 | $58,160 | $11,800 | $46,360 |
| 2016 | $1,292 | $41,640 | $8,760 | $32,880 |
| 2015 | $1,223 | $38,760 | $8,400 | $30,360 |
| 2014 | $1,045 | $32,800 | $7,680 | $25,120 |
| 2013 | -- | $32,920 | $7,800 | $25,120 |
Source: Public Records
Map
Nearby Homes
- 1657 Karsyn Ln
- 2790 Deerfield Dr
- 859 Aspen Dr
- 7306 Mount Vernon Rd
- 7368 Mount Vernon Rd
- 2019 Dutchess Rd
- 3138 Beechwood Dr
- 6889 Kingsboro Dr Unit 2
- 7621 Forest Glen Way Unit 2
- 3245 W Anderson Dr
- 542 Hasty Dr
- 1657 Bradmere Ln
- 3940 Fairhaven Rd
- 2765 Montie Ct
- 6627 Coventry Point
- 6718 Roscommon Dr
- 7315 Lee Rd
- 1651 Sloping Tree Way
- 1651 Sloping Tree Way Unit 6
- 1667 Sloping Tree Way Unit 6
- 1643 Sloping Tree Way
- 1646 Karsyn Ln Unit 6
- 1630 Karsyn Ln Unit 6
- 1622 Karsyn Ln
- 1638 Karsyn Ln Unit 143
- 1638 Karsyn Ln Unit 6
- 1635 Sloping Tree Way Unit 6
- 1676 Sloping Tree Way Unit 6
- 1658 Sloping Tree Way
- 1668 Sloping Tree Way
- 1654 Karsyn Ln
- 1675 Sloping Tree Way Unit 6
- 1614 Karsyn Ln Unit 6
- 0 Sloping Tree Way Unit 7381484
- 0 Sloping Tree Way
- 1650 Sloping Tree Way
- 1642 Sloping Tree Way