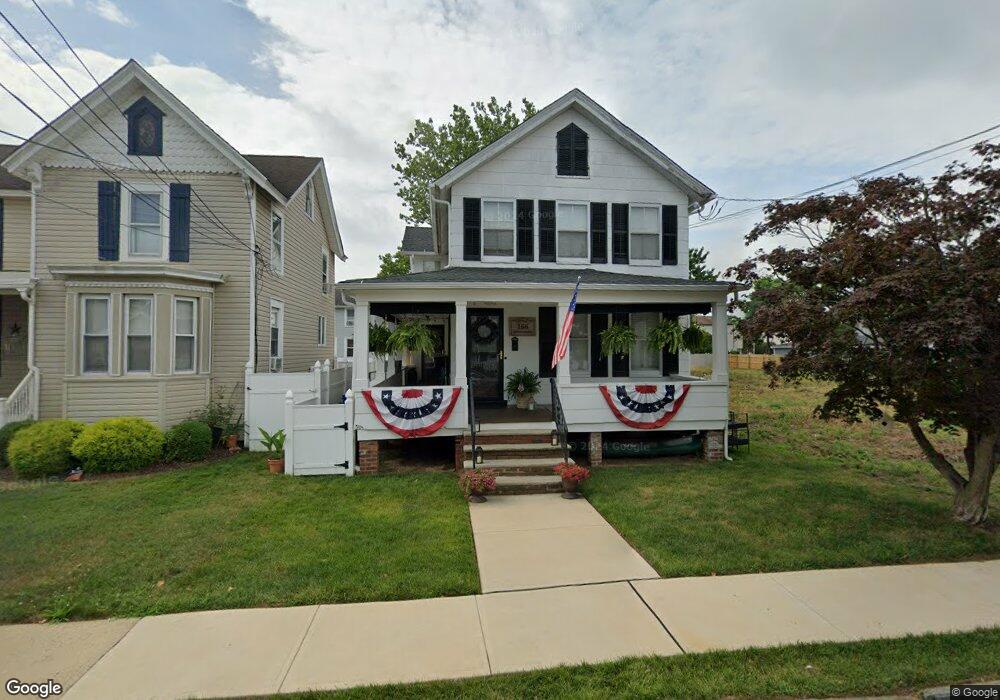
166 2nd St Keyport, NJ 07735
Estimated Value: $386,205 - $470,000
3
Beds
1
Bath
1,488
Sq Ft
$297/Sq Ft
Est. Value
About This Home
This home is located at 166 2nd St, Keyport, NJ 07735 and is currently estimated at $442,051, approximately $297 per square foot. 166 2nd St is a home located in Monmouth County with nearby schools including Keyport Central School, Keyport High School, and Icob Academy.
Ownership History
Date
Name
Owned For
Owner Type
Purchase Details
Closed on
May 21, 2019
Sold by
Meglow Cheryl and Fisher Cheryl A
Bought by
Fisher Cheryl A and Fisher Paul
Current Estimated Value
Home Financials for this Owner
Home Financials are based on the most recent Mortgage that was taken out on this home.
Original Mortgage
$192,000
Outstanding Balance
$168,464
Interest Rate
4.1%
Mortgage Type
New Conventional
Estimated Equity
$273,587
Purchase Details
Closed on
Apr 22, 2008
Sold by
Stahl Kelly J
Bought by
Meglow Cheryl
Home Financials for this Owner
Home Financials are based on the most recent Mortgage that was taken out on this home.
Original Mortgage
$6,878
Interest Rate
6.22%
Mortgage Type
Stand Alone Second
Purchase Details
Closed on
Feb 15, 2006
Sold by
Applegate Dorothy J
Bought by
Stahl Kelly Jean
Create a Home Valuation Report for This Property
The Home Valuation Report is an in-depth analysis detailing your home's value as well as a comparison with similar homes in the area
Home Values in the Area
Average Home Value in this Area
Purchase History
| Date | Buyer | Sale Price | Title Company |
|---|---|---|---|
| Fisher Cheryl A | -- | Servicelink Fast Escrow | |
| Meglow Cheryl | $181,000 | Stewart Title Guaranty Co | |
| Stahl Kelly Jean | -- | -- |
Source: Public Records
Mortgage History
| Date | Status | Borrower | Loan Amount |
|---|---|---|---|
| Open | Fisher Cheryl A | $192,000 | |
| Closed | Meglow Cheryl | $6,878 | |
| Closed | Meglow Cheryl | $171,950 |
Source: Public Records
Tax History Compared to Growth
Tax History
| Year | Tax Paid | Tax Assessment Tax Assessment Total Assessment is a certain percentage of the fair market value that is determined by local assessors to be the total taxable value of land and additions on the property. | Land | Improvement |
|---|---|---|---|---|
| 2025 | $6,318 | $345,400 | $169,100 | $176,300 |
| 2024 | $6,229 | $305,200 | $135,500 | $169,700 |
| 2023 | $6,229 | $283,400 | $123,200 | $160,200 |
| 2022 | $5,492 | $246,400 | $107,200 | $139,200 |
| 2021 | $5,492 | $217,600 | $93,200 | $124,400 |
| 2020 | $5,228 | $205,600 | $87,300 | $118,300 |
| 2019 | $5,063 | $199,400 | $83,800 | $115,600 |
| 2018 | $4,823 | $185,500 | $77,400 | $108,100 |
| 2017 | $4,839 | $185,600 | $78,800 | $106,800 |
| 2016 | $4,658 | $180,200 | $78,800 | $101,400 |
| 2015 | $4,514 | $173,800 | $73,800 | $100,000 |
| 2014 | $3,133 | $121,800 | $48,800 | $73,000 |
Source: Public Records
Map
Nearby Homes