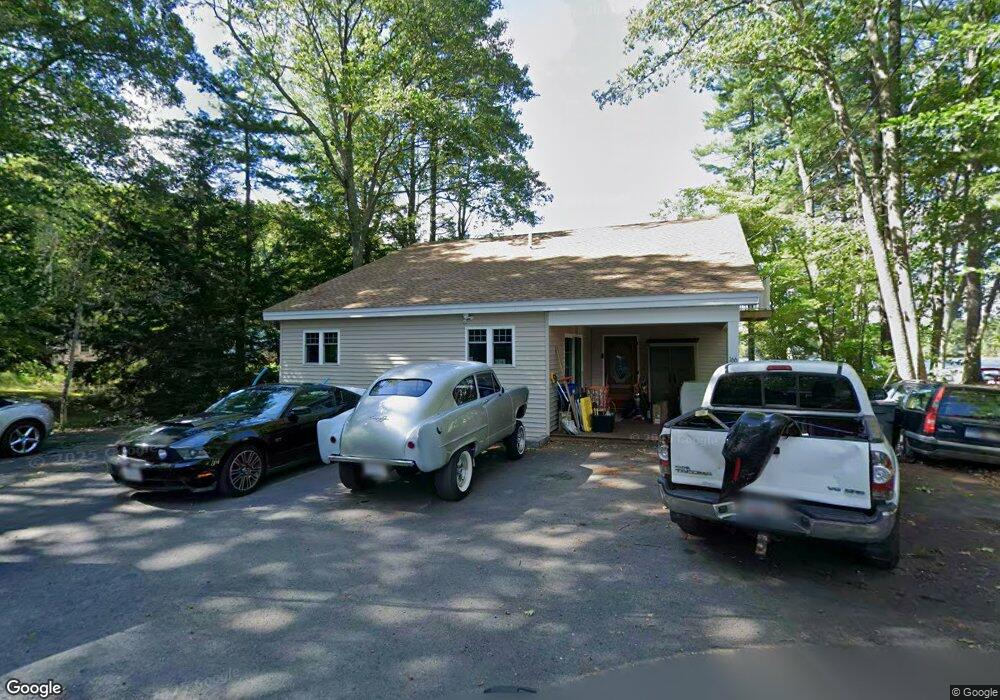
166 2nd St Winchendon, MA 01475
Estimated Value: $239,000 - $390,190
About This Home
This home is located at 166 2nd St, Winchendon, MA 01475 and is currently estimated at $338,048, approximately $328 per square foot. 166 2nd St is a home located in Worcester County with nearby schools including Memorial and Toy Town Elementary School.
Ownership History
We collect this data history from publicly available records. To have your information removed, we recommend requesting removal directly through your county’s website.
Purchase Details
Home Financials for this Owner
Home Financials are based on the most recent Mortgage that was taken out on this home.Home Values in the Area
Average Home Value in this Area
Purchase History
We collect this data history from publicly available records. To have your information removed, we recommend requesting removal directly through your county’s website.
| Date | Buyer | Sale Price | Title Company |
|---|---|---|---|
| $200,000 | -- | ||
| $200,000 | -- |
Mortgage History
We collect this data history from publicly available records. To have your information removed, we recommend requesting removal directly through your county’s website.
| Date | Status | Borrower | Loan Amount |
|---|---|---|---|
| Open | $150,000 | ||
| Closed | $150,000 |
Tax History
We collect this data history from publicly available records. To have your information removed, we recommend requesting removal directly through your county’s website.
| Year | Tax Paid | Tax Assessment Tax Assessment Total Assessment is a certain percentage of the fair market value that is determined by local assessors to be the total taxable value of land and additions on the property. | Land | Improvement |
|---|---|---|---|---|
| 2025 | $2,979 | $253,500 | $202,200 | $51,300 |
| 2024 | $3,085 | $246,000 | $194,700 | $51,300 |
| 2023 | $3,156 | $235,500 | $185,000 | $50,500 |
| 2022 | $3,774 | $249,800 | $185,000 | $64,800 |
| 2021 | $3,590 | $228,400 | $168,100 | $60,300 |
| 2020 | $3,562 | $218,800 | $160,000 | $58,800 |
| 2019 | $3,385 | $202,600 | $146,000 | $56,600 |
| 2018 | $3,128 | $180,300 | $129,800 | $50,500 |
| 2017 | $3,454 | $192,200 | $142,500 | $49,700 |
| 2016 | $3,080 | $176,700 | $129,200 | $47,500 |
| 2015 | $2,954 | $176,700 | $129,200 | $47,500 |
| 2014 | $3,099 | $194,200 | $148,200 | $46,000 |
Map
- 5 Island Rd
- 101 Hubbard Hill Rd
- 118 Lachance Dr
- 78 Colburn Ln
- 33 Andel Ave
- 18 Marina Way
- 262 E Monomonac Rd
- 590 Main St
- 6 Country Meadows Dr
- 170 Glenallen St
- 375 Main St
- 14 Tico Rd
- 16 Maple Place
- 407 Middle Winchendon Rd
- 452 Middle Winchendon Rd
- Lot 2 Saybrook Dr
- 52 Peggi Ln
- 110 W Shore Dr
- 803 Nh Route 119
- 64 Old Ashburnham Rd
- 175 2nd St
- 185 2nd St
- L-1 Joslin St
- M8-83 Rear Hitchcock Rd
- LOT 1 Hill St
- LOT 11 Lakeshore Dr
- LOT 1 Lakeshore Dr
- LOT 11 Alger St
- LOT 13 Alger St
- LOT 12 Alger St
- LOT 5 West St
- L24B Shady Glen Terrace
- L-24 Shady Glen Terrace
- L24C Shady Glen Terrace
- LOT 3 West St
- LOT 4 Benjamin St
- LOT 9 Lakeshore Dr
- L-17 Eagle Dr
- LOT 2A Alger St
- LOT 4A Alger St
Ask me questions while you tour the home.