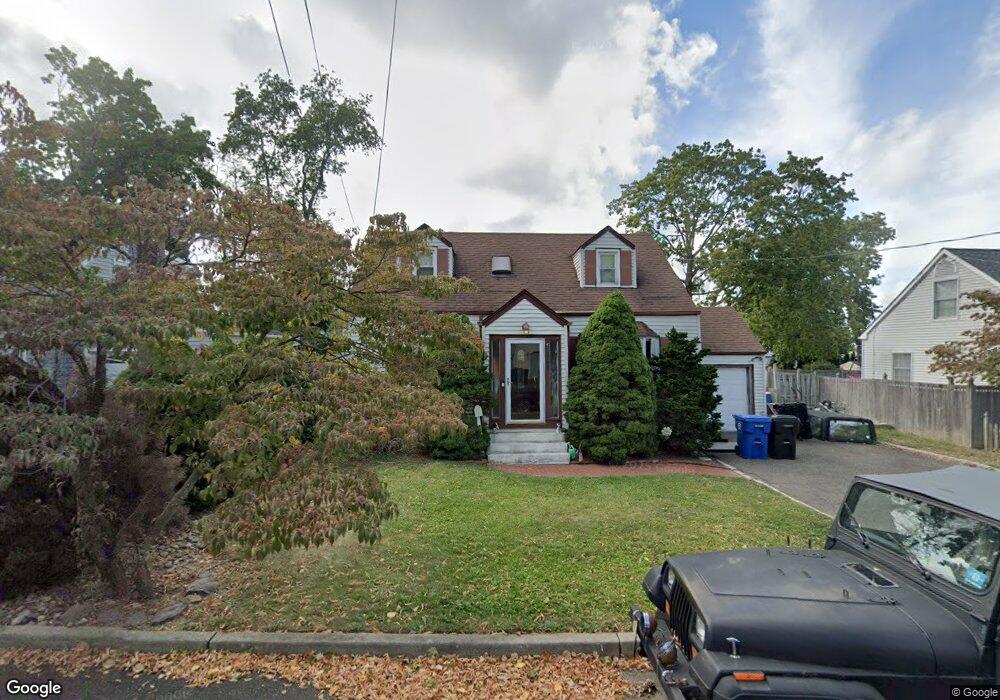
166 9th St Belford, NJ 07718
New Monmouth NeighborhoodEstimated Value: $556,660 - $607,000
4
Beds
1
Bath
1,512
Sq Ft
$384/Sq Ft
Est. Value
About This Home
This home is located at 166 9th St, Belford, NJ 07718 and is currently estimated at $580,915, approximately $384 per square foot. 166 9th St is a home located in Monmouth County with nearby schools including Bayview Elementary School, Bayshore Middle School, and Middletown High School North.
Ownership History
Date
Name
Owned For
Owner Type
Purchase Details
Closed on
Oct 29, 1993
Sold by
Reinhart Gale
Bought by
O'Toole Michael and O'Toole Gina
Current Estimated Value
Home Financials for this Owner
Home Financials are based on the most recent Mortgage that was taken out on this home.
Original Mortgage
$124,000
Interest Rate
6.83%
Create a Home Valuation Report for This Property
The Home Valuation Report is an in-depth analysis detailing your home's value as well as a comparison with similar homes in the area
Home Values in the Area
Average Home Value in this Area
Purchase History
| Date | Buyer | Sale Price | Title Company |
|---|---|---|---|
| O'Toole Michael | $137,900 | -- |
Source: Public Records
Mortgage History
| Date | Status | Borrower | Loan Amount |
|---|---|---|---|
| Closed | O'Toole Michael | $124,000 |
Source: Public Records
Tax History
| Year | Tax Paid | Tax Assessment Tax Assessment Total Assessment is a certain percentage of the fair market value that is determined by local assessors to be the total taxable value of land and additions on the property. | Land | Improvement |
|---|---|---|---|---|
| 2025 | $7,514 | $519,000 | $335,400 | $183,600 |
| 2024 | $7,235 | $456,800 | $276,600 | $180,200 |
| 2023 | $7,235 | $416,300 | $280,100 | $136,200 |
| 2022 | $6,030 | $361,700 | $232,000 | $129,700 |
| 2021 | $6,030 | $289,900 | $174,600 | $115,300 |
| 2020 | $6,061 | $283,500 | $170,800 | $112,700 |
| 2019 | $5,975 | $282,900 | $170,800 | $112,100 |
| 2018 | $5,502 | $253,900 | $147,000 | $106,900 |
| 2017 | $5,486 | $250,600 | $147,000 | $103,600 |
| 2016 | $5,219 | $244,900 | $137,000 | $107,900 |
| 2015 | $5,405 | $244,900 | $137,000 | $107,900 |
| 2014 | $5,332 | $235,600 | $137,000 | $98,600 |
Source: Public Records
Map
Nearby Homes
Your Personal Tour Guide
Ask me questions while you tour the home.