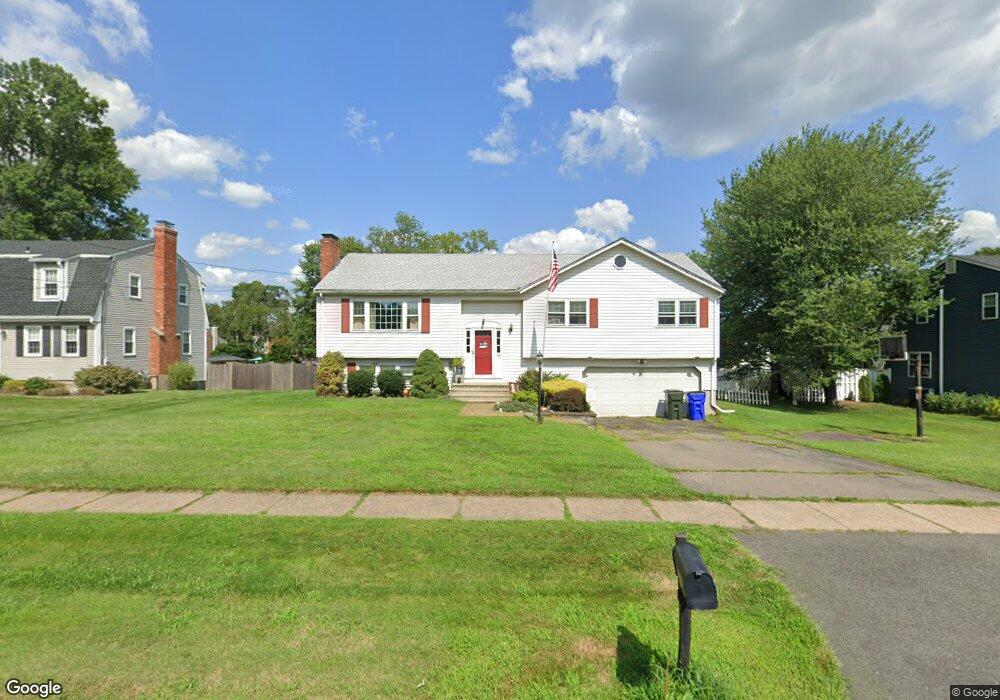
166 Back Ln Wethersfield, CT 06109
Estimated Value: $408,000 - $533,000
3
Beds
3
Baths
1,529
Sq Ft
$319/Sq Ft
Est. Value
About This Home
This home is located at 166 Back Ln, Wethersfield, CT 06109 and is currently estimated at $487,940, approximately $319 per square foot. 166 Back Ln is a home located in Hartford County with nearby schools including Samuel B. Webb Elementary School, Silas Deane Middle School, and Wethersfield High School.
Ownership History
Date
Name
Owned For
Owner Type
Purchase Details
Closed on
Apr 17, 2015
Sold by
Lynch Joseph D
Bought by
Lynch Diana C
Current Estimated Value
Purchase Details
Closed on
Mar 16, 2004
Sold by
Charbonneau Robert A
Bought by
Lynch Joseph D and Lynch Diana C
Home Financials for this Owner
Home Financials are based on the most recent Mortgage that was taken out on this home.
Original Mortgage
$200,000
Interest Rate
5.67%
Purchase Details
Closed on
Dec 22, 1997
Sold by
Haberski Pamela A
Bought by
Charbonneau Robert A
Purchase Details
Closed on
Aug 4, 1994
Sold by
Fhlmc
Bought by
Charbonneau Robert A and Haberski Pamela A
Home Financials for this Owner
Home Financials are based on the most recent Mortgage that was taken out on this home.
Original Mortgage
$139,650
Interest Rate
8.4%
Mortgage Type
Unknown
Create a Home Valuation Report for This Property
The Home Valuation Report is an in-depth analysis detailing your home's value as well as a comparison with similar homes in the area
Home Values in the Area
Average Home Value in this Area
Purchase History
| Date | Buyer | Sale Price | Title Company |
|---|---|---|---|
| Lynch Diana C | -- | -- | |
| Lynch Joseph D | $266,000 | -- | |
| Charbonneau Robert A | $10,000 | -- | |
| Charbonneau Robert A | $147,000 | -- |
Source: Public Records
Mortgage History
| Date | Status | Borrower | Loan Amount |
|---|---|---|---|
| Previous Owner | Charbonneau Robert A | $200,000 | |
| Previous Owner | Charbonneau Robert A | $139,650 | |
| Previous Owner | Charbonneau Robert A | $165,000 |
Source: Public Records
Tax History
| Year | Tax Paid | Tax Assessment Tax Assessment Total Assessment is a certain percentage of the fair market value that is determined by local assessors to be the total taxable value of land and additions on the property. | Land | Improvement |
|---|---|---|---|---|
| 2025 | $12,252 | $297,240 | $104,540 | $192,700 |
| 2024 | $7,818 | $180,890 | $67,900 | $112,990 |
| 2023 | $7,558 | $180,890 | $67,900 | $112,990 |
| 2022 | $7,431 | $180,890 | $67,900 | $112,990 |
| 2021 | $7,357 | $180,890 | $67,900 | $112,990 |
| 2020 | $7,360 | $180,890 | $67,900 | $112,990 |
| 2019 | $7,369 | $180,890 | $67,900 | $112,990 |
| 2018 | $7,569 | $185,600 | $65,800 | $119,800 |
| 2017 | $7,381 | $185,600 | $65,800 | $119,800 |
| 2016 | $7,153 | $185,600 | $65,800 | $119,800 |
| 2015 | $7,088 | $185,600 | $65,800 | $119,800 |
| 2014 | $6,819 | $185,600 | $65,800 | $119,800 |
Source: Public Records
Map
Nearby Homes
- 76 Luca Lane Homesite 8
- 61 Luca Ln
- 8 Stella Dr
- 62 Harold Dr
- 378 Cypress Rd
- 6 Vinnie Dr
- 229 Cottonwood Rd Unit 229
- 98 Crown Ridge
- 5 Robeth Ln
- 15 Woodsedge Dr Unit 5C
- 101 Collier Rd
- 35 Woodsedge Dr Unit 4C
- 0 Collier Rd
- 508 Highland St
- 155 Old Common Rd
- 7 Barrington Dr Unit C
- 417 Churchill Dr Unit 417
- 32 Flagler St
- 144 Churchill Dr
- 18 Stone Hill Dr
- 158 Back Ln
- 7 Whippoorwill Way
- 13 Black Birch Rd
- 23 Black Birch Rd
- 17 Whippoorwill Way
- 150 Back Ln
- 163 Back Ln
- 169 Back Ln
- 157 Back Ln
- 31 Black Birch Rd
- 173 Back Ln
- 8 Whippoorwill Way
- 142 Back Ln
- 16 Whippoorwill Way
- 4 Ledgecrest Dr
- 15 Ledgecrest Dr
- 39 Black Birch Rd
- 109 Ledgecrest Dr
- 18 Black Birch Rd
- 189 Back Ln
Your Personal Tour Guide
Ask me questions while you tour the home.