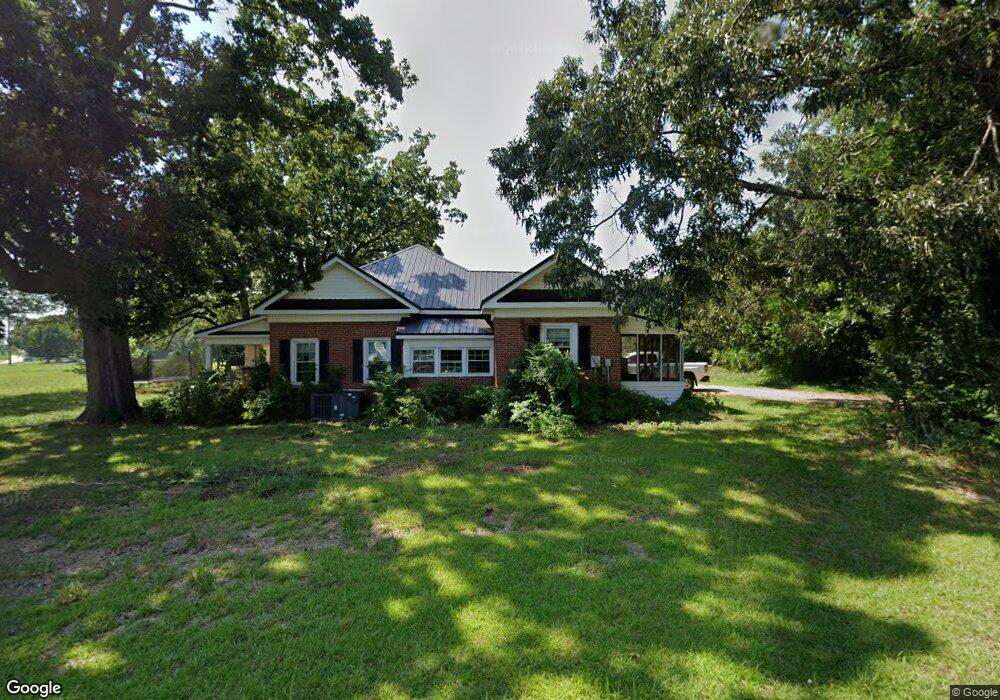
166 Carlisle Bennett Rd Spartanburg, SC 29307
Estimated Value: $197,147 - $266,000
4
Beds
1
Bath
1,672
Sq Ft
$138/Sq Ft
Est. Value
About This Home
This home is located at 166 Carlisle Bennett Rd, Spartanburg, SC 29307 and is currently estimated at $231,287, approximately $138 per square foot. 166 Carlisle Bennett Rd is a home located in Spartanburg County with nearby schools including Broome High School and Mountain View Christian Academy.
Ownership History
Date
Name
Owned For
Owner Type
Purchase Details
Closed on
Dec 15, 2010
Sold by
Geddings Sheila
Bought by
Geddings Joshua D
Current Estimated Value
Home Financials for this Owner
Home Financials are based on the most recent Mortgage that was taken out on this home.
Original Mortgage
$92,201
Outstanding Balance
$61,194
Interest Rate
4.31%
Mortgage Type
FHA
Estimated Equity
$170,093
Purchase Details
Closed on
Dec 10, 2010
Sold by
Bennett Arthur Lee
Bought by
Geddings Joshua D and Geddings Sheila
Home Financials for this Owner
Home Financials are based on the most recent Mortgage that was taken out on this home.
Original Mortgage
$92,201
Outstanding Balance
$61,194
Interest Rate
4.31%
Mortgage Type
FHA
Estimated Equity
$170,093
Purchase Details
Closed on
Dec 18, 2002
Sold by
Bennett James Arthur
Bought by
Bennett Mary Jo and Bennett Arthur Lee
Purchase Details
Closed on
Oct 4, 1999
Sold by
Bennett James A
Bought by
Arthur Terry
Create a Home Valuation Report for This Property
The Home Valuation Report is an in-depth analysis detailing your home's value as well as a comparison with similar homes in the area
Home Values in the Area
Average Home Value in this Area
Purchase History
| Date | Buyer | Sale Price | Title Company |
|---|---|---|---|
| Geddings Joshua D | -- | -- | |
| Geddings Joshua D | $94,600 | -- | |
| Bennett Mary Jo | -- | -- | |
| Arthur Terry | $8,000 | -- |
Source: Public Records
Mortgage History
| Date | Status | Borrower | Loan Amount |
|---|---|---|---|
| Open | Geddings Joshua D | $92,201 |
Source: Public Records
Tax History Compared to Growth
Tax History
| Year | Tax Paid | Tax Assessment Tax Assessment Total Assessment is a certain percentage of the fair market value that is determined by local assessors to be the total taxable value of land and additions on the property. | Land | Improvement |
|---|---|---|---|---|
| 2025 | $949 | $5,083 | $1,229 | $3,854 |
| 2024 | $949 | $5,083 | $1,229 | $3,854 |
| 2023 | $949 | $5,083 | $1,229 | $3,854 |
| 2022 | $850 | $4,420 | $1,144 | $3,276 |
| 2021 | $850 | $4,420 | $1,144 | $3,276 |
| 2020 | $834 | $4,420 | $1,144 | $3,276 |
| 2019 | $956 | $4,420 | $1,144 | $3,276 |
| 2018 | $785 | $4,420 | $1,144 | $3,276 |
| 2017 | $653 | $3,904 | $1,144 | $2,760 |
| 2016 | $653 | $3,904 | $1,144 | $2,760 |
| 2015 | $648 | $3,904 | $1,144 | $2,760 |
| 2014 | $643 | $3,904 | $1,144 | $2,760 |
Source: Public Records
Map
Nearby Homes
- 215 Penny Bennett Rd
- 204 Bennett Dairy Rd
- 1926 Bud Arthur Bridge Rd
- 124 Childress Rd
- 230 Idlewood Cir
- 655 Idlewood Cir
- 000 Burns Rd Unit LOT 1
- 000 Burns Rd
- 000 Burns Rd Unit LOT 2
- 112 Riverview Park
- 49 Thurgood Marshall Rd
- Lot 31 State Road S-42-2288
- 250 Leeds Ln
- 270 Leeds Ln
- 0 Old Converse Rd
- 3091 E Main Street Extension
- 276 Saranac Dr
- 4026 Mancini Rd
- Nassau Cove Plan at Berkeley - Villas
- 3025 E Main Street Extension
- 163 Carlisle Bennett Rd
- 159 Carlisle Bennett Rd
- 1420 Old Converse Rd
- 154 Carlisle Bennett Rd
- 155 Carlisle Bennett Rd
- 1410 Old Converse Rd
- 105 Sprouse Rd
- 109 Sprouse Rd
- 113 Sprouse Rd
- 151 Carlisle Bennett Rd
- 1402 Old Converse Rd
- 117 Sprouse Rd
- 657 Tacoma Trail
- 314 Bennett Dairy Rd
- 653 Tacoma Trail
- 649 Tacoma Trail
- 673 Tacoma Trail
- 147 Carlisle Bennett Rd
- 645 Tacoma Trail
- 677 Tacoma Trail