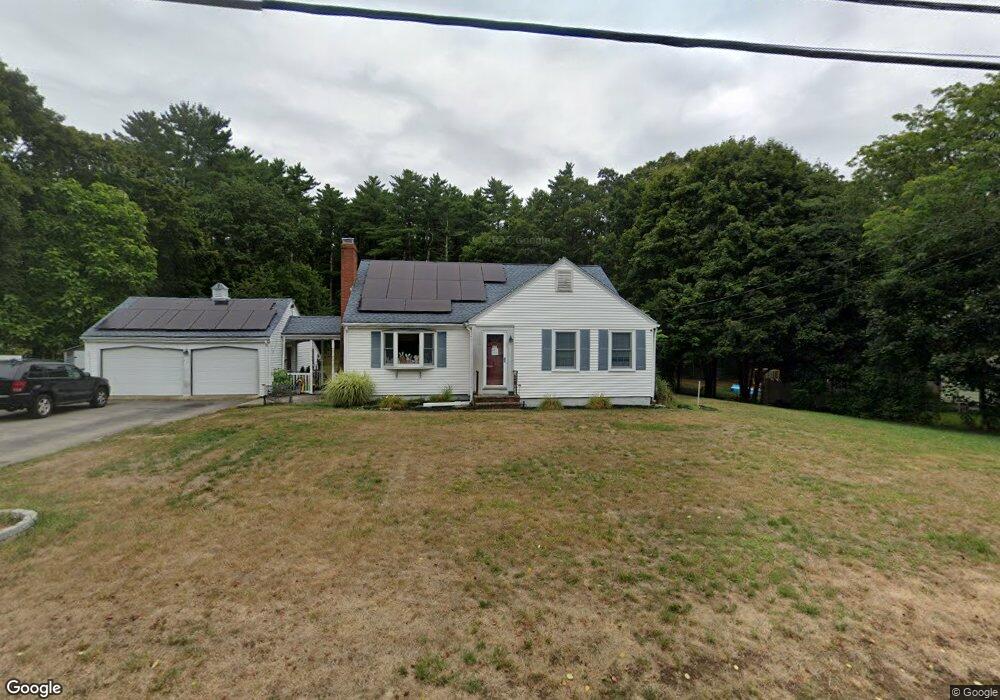
166 Cross St Hanover, MA 02339
Estimated Value: $727,000 - $767,000
2
Beds
2
Baths
2,324
Sq Ft
$320/Sq Ft
Est. Value
About This Home
This home is located at 166 Cross St, Hanover, MA 02339 and is currently estimated at $744,076, approximately $320 per square foot. 166 Cross St is a home located in Plymouth County with nearby schools including Hanover High School, The Master's Academy, and Cardinal Cushing Centers.
Ownership History
Date
Name
Owned For
Owner Type
Purchase Details
Closed on
Feb 27, 1998
Sold by
Barbara Mann T
Bought by
Manning Patricia A
Current Estimated Value
Home Financials for this Owner
Home Financials are based on the most recent Mortgage that was taken out on this home.
Original Mortgage
$144,800
Interest Rate
6.85%
Mortgage Type
Purchase Money Mortgage
Create a Home Valuation Report for This Property
The Home Valuation Report is an in-depth analysis detailing your home's value as well as a comparison with similar homes in the area
Home Values in the Area
Average Home Value in this Area
Purchase History
| Date | Buyer | Sale Price | Title Company |
|---|---|---|---|
| Manning Patricia A | $181,000 | -- |
Source: Public Records
Mortgage History
| Date | Status | Borrower | Loan Amount |
|---|---|---|---|
| Open | Manning Patricia A | $272,000 | |
| Closed | Manning Patricia A | $280,000 | |
| Closed | Manning Patricia A | $20,000 | |
| Closed | Manning Patricia A | $144,800 |
Source: Public Records
Tax History
| Year | Tax Paid | Tax Assessment Tax Assessment Total Assessment is a certain percentage of the fair market value that is determined by local assessors to be the total taxable value of land and additions on the property. | Land | Improvement |
|---|---|---|---|---|
| 2025 | $7,758 | $628,200 | $285,200 | $343,000 |
| 2024 | $7,574 | $589,900 | $285,200 | $304,700 |
| 2023 | $7,653 | $567,300 | $259,900 | $307,400 |
| 2022 | $7,890 | $517,400 | $247,200 | $270,200 |
| 2021 | $7,755 | $474,900 | $202,100 | $272,800 |
| 2020 | $7,857 | $481,700 | $213,700 | $268,000 |
| 2019 | $7,311 | $445,500 | $213,700 | $231,800 |
| 2018 | $7,173 | $440,600 | $213,700 | $226,900 |
| 2017 | $6,780 | $410,400 | $209,600 | $200,800 |
| 2016 | $6,688 | $396,700 | $191,000 | $205,700 |
| 2015 | $6,029 | $373,300 | $177,300 | $196,000 |
Source: Public Records
Map
Nearby Homes
- 114 Graham Hill Dr
- 51 Cervelli Farm Dr
- 37 Dr
- 23 Cervelli Farm Dr
- 38 Cervelli Farm Dr
- 9 Cervelli Farm Dr
- 250 Center St
- 36 Grove St
- 95 Tecumseh Dr
- 339 State St
- 35 Sproul Rd
- 108 Waterford Dr
- 70 Bardin St
- 430 Brook Bend Rd
- 51 Farmside Dr
- 75 School St
- 139 Fairwood Dr
- 7 Farmside Dr
- 561 Circuit St
- 285 W Elm St
- 172 Cross St
- 20 Te Berry Farm Rd
- 146 Cross St
- 208 Lot 2 Cross St
- Lot-3- 208 Cross St
- Lot-2- 208 Cross St
- 138 Cross St
- 125 Cross St
- 125 Cross St
- 165 Cross St
- 24 Te Berry Farm Rd
- 24 Te Berry Farm Rd
- 24 Te Berry Farm Rd
- 149 Cross St
- 128 Cross St
- 3 Te Berry Farm Rd
- 202 Cross St
- 145 Cross St
- 137 Cross St
- 118 Cross St
Your Personal Tour Guide
Ask me questions while you tour the home.