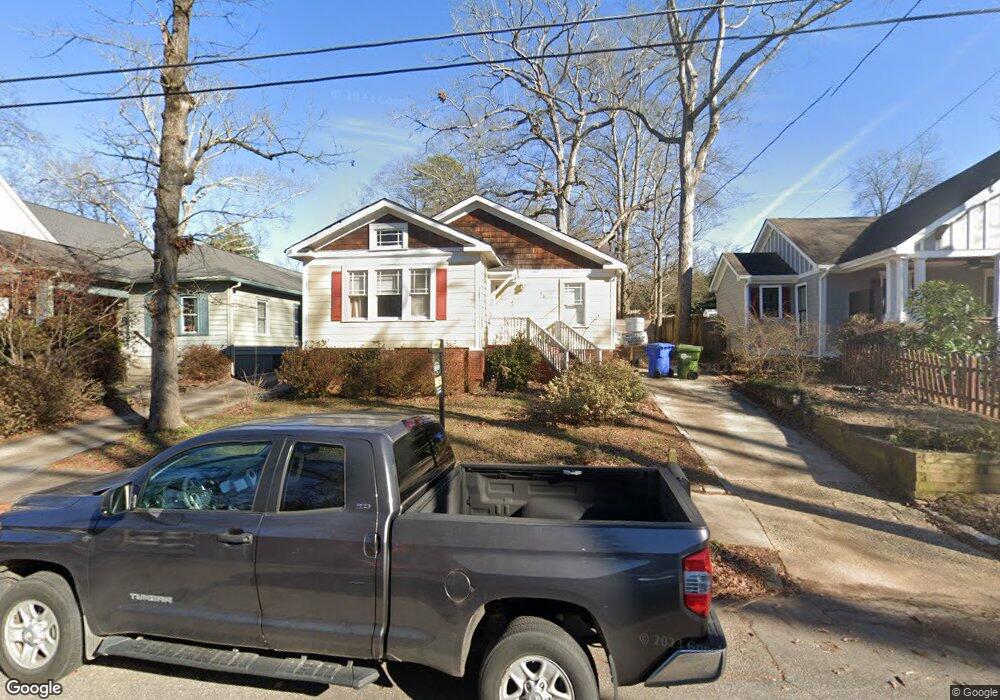
166 Daniel Ave SE Atlanta, GA 30317
East Lake NeighborhoodEstimated Value: $570,471 - $683,000
4
Beds
2
Baths
1,822
Sq Ft
$329/Sq Ft
Est. Value
About This Home
This home is located at 166 Daniel Ave SE, Atlanta, GA 30317 and is currently estimated at $599,618, approximately $329 per square foot. 166 Daniel Ave SE is a home located in DeKalb County with nearby schools including Toomer Elementary School, King Middle School, and Maynard Holbrook Jackson High School.
Ownership History
Date
Name
Owned For
Owner Type
Purchase Details
Closed on
May 30, 2008
Sold by
Gmac Mortgage Corp Llc
Bought by
Berry Tara N
Current Estimated Value
Home Financials for this Owner
Home Financials are based on the most recent Mortgage that was taken out on this home.
Original Mortgage
$35,000
Outstanding Balance
$7,408
Interest Rate
6.02%
Mortgage Type
Stand Alone Refi Refinance Of Original Loan
Estimated Equity
$592,210
Purchase Details
Closed on
Feb 5, 2008
Sold by
Smith Terry E
Bought by
Gmac Mortgage Corp Llc
Purchase Details
Closed on
May 30, 2006
Sold by
Brown Peter
Bought by
Smith Terry E
Home Financials for this Owner
Home Financials are based on the most recent Mortgage that was taken out on this home.
Original Mortgage
$48,980
Interest Rate
7.25%
Mortgage Type
Stand Alone Refi Refinance Of Original Loan
Purchase Details
Closed on
Aug 19, 2002
Sold by
Pernell Eunice S
Bought by
Brown Peter
Create a Home Valuation Report for This Property
The Home Valuation Report is an in-depth analysis detailing your home's value as well as a comparison with similar homes in the area
Home Values in the Area
Average Home Value in this Area
Purchase History
| Date | Buyer | Sale Price | Title Company |
|---|---|---|---|
| Berry Tara N | $175,000 | -- | |
| Gmac Mortgage Corp Llc | $190,000 | -- | |
| Smith Terry E | $244,900 | -- | |
| Brown Peter | $158,000 | -- |
Source: Public Records
Mortgage History
| Date | Status | Borrower | Loan Amount |
|---|---|---|---|
| Open | Berry Tara N | $35,000 | |
| Previous Owner | Smith Terry E | $48,980 |
Source: Public Records
Tax History
| Year | Tax Paid | Tax Assessment Tax Assessment Total Assessment is a certain percentage of the fair market value that is determined by local assessors to be the total taxable value of land and additions on the property. | Land | Improvement |
|---|---|---|---|---|
| 2025 | -- | $189,400 | $60,000 | $129,400 |
| 2024 | -- | $199,680 | $60,000 | $139,680 |
| 2023 | $3,633 | $181,520 | $60,000 | $121,520 |
Source: Public Records
Map
Nearby Homes
- 2668 Memorial Dr SE
- 2660 Colgan Ct SE
- 49 Daniel Ave SE
- 34 Daniel Ave SE
- 2704 Alston Dr SE
- 2824 Tupelo St SE
- 25 Daniel Ave NE
- 98 Candler Rd SE
- 235 Candler Rd SE
- 2524 Tilson Dr SE
- 2882 Alston Dr SE
- 25 Candler Rd SE
- 2523 Hosea L Williams Dr SE
- 2876 Alexa Ave SE
- 2480 Memorial Dr SE
- 2468 E Tupelo St SE
- 2877 Alexa Ave SE
- 246 Garland Ave
- 371 Hooper St SE
- 431 Chevelle Ln
- 160 Daniel Ave SE
- 176 Daniel Ave SE
- 158 Daniel Ave SE
- 2725 Tupelo St SE
- 2719 Tupelo St SE
- 2709 Tupelo St SE
- 161 Daniel Ave SE
- 2710 Memorial Dr SE
- 167 Daniel Ave SE
- 2720 Memorial Dr SE
- 2732 Memorial Dr SE
- 2729 Tupelo St SE
- 2735 Tupelo St SE
- 155 Daniel Ave SE
- 2738 Memorial Dr SE
- 145 Daniel Ave SE
- 139 Daniel Ave SE
- 2696 Memorial Dr SE
- 2745 Tupelo St SE
- 131 Daniel Ave SE
Your Personal Tour Guide
Ask me questions while you tour the home.