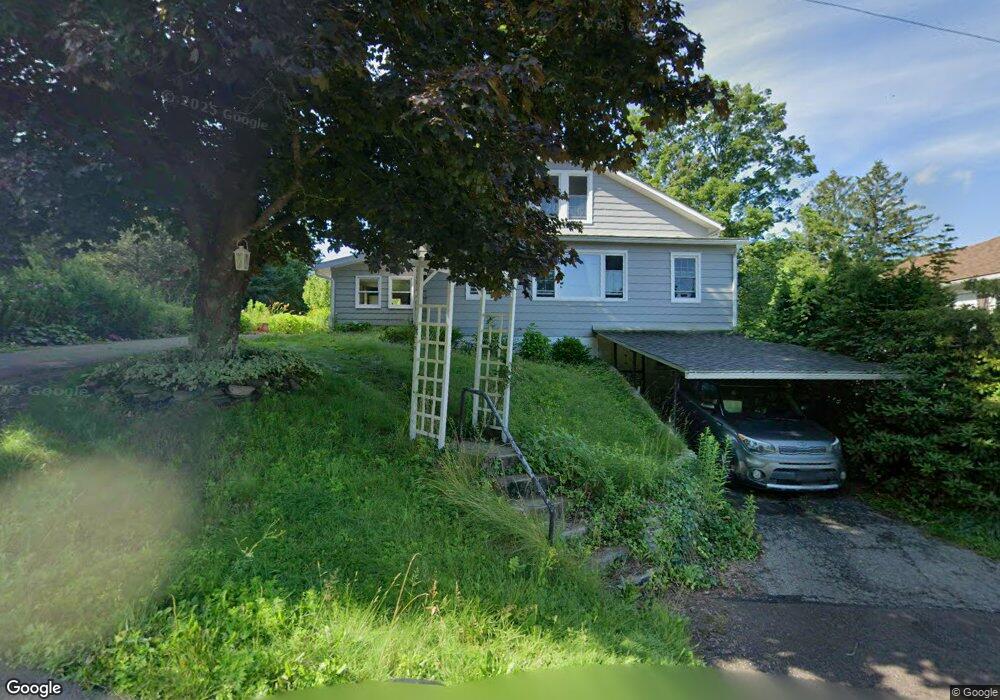
166 E Cherry St Unit T401 Dushore, PA 18614
Estimated Value: $131,790 - $195,000
4
Beds
1
Bath
1,424
Sq Ft
$117/Sq Ft
Est. Value
About This Home
This home is located at 166 E Cherry St Unit T401, Dushore, PA 18614 and is currently estimated at $166,198, approximately $116 per square foot. 166 E Cherry St Unit T401 is a home located in Sullivan County with nearby schools including Sullivan County Elementary School and Sullivan County High School.
Ownership History
Date
Name
Owned For
Owner Type
Purchase Details
Closed on
Nov 22, 2022
Sold by
Nolan Jerrod J and Nolan Mary E
Bought by
Ammerman Ean James
Current Estimated Value
Home Financials for this Owner
Home Financials are based on the most recent Mortgage that was taken out on this home.
Original Mortgage
$136,363
Outstanding Balance
$132,135
Interest Rate
6.95%
Mortgage Type
New Conventional
Estimated Equity
$34,064
Purchase Details
Closed on
Sep 12, 2022
Sold by
Nolan Jerrod J and Nolan Mary E
Bought by
Richlin Tyrel and Richlin Ashleigh
Purchase Details
Closed on
Dec 21, 2015
Sold by
Nolan Jerrod J and Shaffer Robin K
Bought by
Nolan Jerrod J
Home Financials for this Owner
Home Financials are based on the most recent Mortgage that was taken out on this home.
Original Mortgage
$88,275
Interest Rate
3.97%
Mortgage Type
FHA
Purchase Details
Closed on
Jul 30, 2008
Sold by
White Laura
Bought by
Nolan Jerrod J and Nolan Robin K
Home Financials for this Owner
Home Financials are based on the most recent Mortgage that was taken out on this home.
Original Mortgage
$93,177
Interest Rate
6.4%
Mortgage Type
FHA
Create a Home Valuation Report for This Property
The Home Valuation Report is an in-depth analysis detailing your home's value as well as a comparison with similar homes in the area
Purchase History
| Date | Buyer | Sale Price | Title Company |
|---|---|---|---|
| Ammerman Ean James | $135,000 | Lg Settlement Services | |
| Richlin Mark A | $250 | -- | |
| Richlin Tyrel | $2,250 | -- | |
| Nolan Jerrod J | -- | None Available | |
| Nolan Jerrod J | $94,000 | None Available |
Source: Public Records
Mortgage History
| Date | Status | Borrower | Loan Amount |
|---|---|---|---|
| Open | Ammerman Ean James | $136,363 | |
| Previous Owner | Nolan Jerrod J | $88,275 | |
| Previous Owner | Nolan Jerrod J | $93,177 |
Source: Public Records
Tax History
| Year | Tax Paid | Tax Assessment Tax Assessment Total Assessment is a certain percentage of the fair market value that is determined by local assessors to be the total taxable value of land and additions on the property. | Land | Improvement |
|---|---|---|---|---|
| 2025 | $1,251 | $53,200 | $9,300 | $43,900 |
| 2024 | $1,210 | $53,200 | $9,300 | $43,900 |
| 2023 | $1,154 | $53,200 | $9,300 | $43,900 |
| 2022 | $373 | $53,600 | $9,700 | $43,900 |
| 2021 | $373 | $53,600 | $9,700 | $43,900 |
| 2020 | $1,125 | $53,600 | $9,700 | $43,900 |
| 2019 | $1,104 | $53,600 | $9,700 | $43,900 |
| 2017 | $1,071 | $53,600 | $9,700 | $43,900 |
| 2015 | $497 | $53,400 | $9,700 | $43,700 |
| 2014 | $497 | $53,400 | $9,700 | $43,700 |
| 2012 | $497 | $53,400 | $9,700 | $43,700 |
Source: Public Records
Map
Nearby Homes
- 181 E Cherry St
- PARCEL 001 Route 220 Hwy
- 223 S German St
- 240 S German St
- 1070 Hayes Rd
- 68 Center St
- 1050 Old Bernice Rd
- 595 Old Bernice Rd
- 0 Old Bernice Rd Unit 31721825
- 1319 Ambrosius Rd
- 8028 U S 220
- 1750 Murphy Rd
- 3272 Pelton Hill Rd
- 15 Flat St
- 303 Crawford Rd
- 4526 Pennsylvania 487
- 272 Crawford Rd
- 5751 Pennsylvania 487
- 2200 Overton Rd
- 338 Front St
- 164 E Cherry St
- 164 E Cherry St
- 162 E Cherry St
- 161 E Cherry St
- 158 E Cherry St
- 221 Bernice Rd
- 172 E Cherry St
- 223 Bernice Rd Unit RT487
- 157 E Cherry St
- 112 Thomson Ave
- 201 Bernice Rd
- 113 Thomson Ave
- 181 E East Cherry St
- 159 E Cherry St
- 212 Bernice Rd
- 116 Thomson Ave
- 125 Beech St
- 131 Beech St
- 121 Beech St
- 184 E Cherry St
Your Personal Tour Guide
Ask me questions while you tour the home.