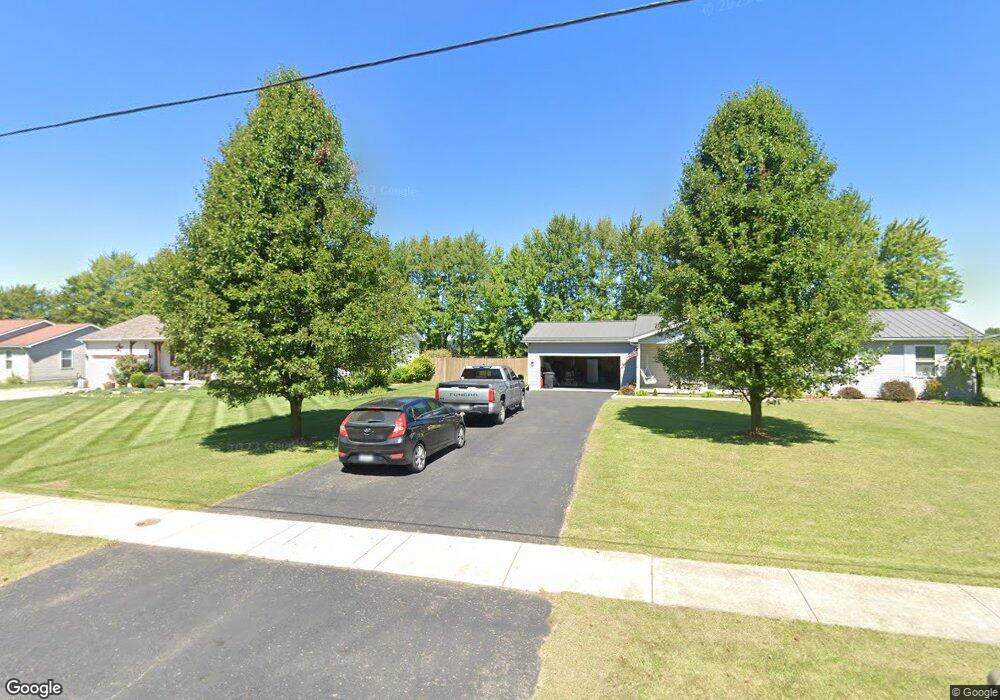
166 E Williams St Cardington, OH 43315
Estimated Value: $220,640 - $249,000
3
Beds
2
Baths
1,400
Sq Ft
$168/Sq Ft
Est. Value
About This Home
This home is located at 166 E Williams St, Cardington, OH 43315 and is currently estimated at $234,660, approximately $167 per square foot. 166 E Williams St is a home located in Morrow County with nearby schools including Cardington-Lincoln Elementary School, Cardington Intermediate School, and Cardington-Lincoln High School.
Ownership History
Date
Name
Owned For
Owner Type
Purchase Details
Closed on
May 22, 2020
Sold by
Reichardt Amanda D and Everly Amanda D
Bought by
Reichardt Amanda D and Reichardt Matthew P
Current Estimated Value
Home Financials for this Owner
Home Financials are based on the most recent Mortgage that was taken out on this home.
Original Mortgage
$76,250
Outstanding Balance
$53,335
Interest Rate
3.3%
Mortgage Type
New Conventional
Estimated Equity
$181,325
Purchase Details
Closed on
Aug 21, 2008
Sold by
Higley Robert M
Bought by
Everly Amanda D
Purchase Details
Closed on
Apr 25, 2008
Bought by
Higley Robert M
Purchase Details
Closed on
Jan 22, 2008
Sold by
Doubikin James and Doubikin Angela
Bought by
Hsbc Bank Usa National Association
Purchase Details
Closed on
Jun 20, 2005
Sold by
Morgan Frank
Bought by
Doubikin James and Doubikin Angela
Purchase Details
Closed on
Sep 23, 2003
Bought by
Morgan Frank
Create a Home Valuation Report for This Property
The Home Valuation Report is an in-depth analysis detailing your home's value as well as a comparison with similar homes in the area
Home Values in the Area
Average Home Value in this Area
Purchase History
| Date | Buyer | Sale Price | Title Company |
|---|---|---|---|
| Reichardt Amanda D | -- | None Available | |
| Everly Amanda D | $80,000 | -- | |
| Higley Robert M | $54,000 | -- | |
| Hsbc Bank Usa National Association | $76,000 | -- | |
| Doubikin James | $133,000 | -- | |
| Morgan Frank | -- | -- |
Source: Public Records
Mortgage History
| Date | Status | Borrower | Loan Amount |
|---|---|---|---|
| Open | Reichardt Amanda D | $76,250 |
Source: Public Records
Tax History Compared to Growth
Tax History
| Year | Tax Paid | Tax Assessment Tax Assessment Total Assessment is a certain percentage of the fair market value that is determined by local assessors to be the total taxable value of land and additions on the property. | Land | Improvement |
|---|---|---|---|---|
| 2024 | $2,496 | $57,790 | $10,010 | $47,780 |
| 2023 | $2,496 | $57,790 | $10,010 | $47,780 |
| 2022 | $2,211 | $45,580 | $7,950 | $37,630 |
| 2021 | $2,194 | $45,580 | $7,950 | $37,630 |
| 2020 | $2,151 | $45,580 | $7,950 | $37,630 |
| 2019 | $1,882 | $38,610 | $6,720 | $31,890 |
| 2018 | $1,881 | $38,610 | $6,720 | $31,890 |
| 2017 | $1,855 | $38,610 | $6,720 | $31,890 |
| 2016 | $1,696 | $35,350 | $6,370 | $28,980 |
| 2015 | $1,604 | $35,350 | $6,370 | $28,980 |
| 2014 | $1,626 | $35,350 | $6,370 | $28,980 |
| 2013 | $1,737 | $37,240 | $6,720 | $30,520 |
Source: Public Records
Map
Nearby Homes
- 329 N Marion St
- 343 E Williams St
- 134 E Main St
- 128 Gilead St
- 0001 Reichelderfer St
- 0002 Reichelderfer St
- 113 E Walnut St
- 001 Reichelderfer St
- 332 W Main St
- 327 S Marion St
- 221 Nichols St
- 423 Douglas St
- Lot 0 Chesterville Ave
- 2837 State Route 529
- 2132 County Road 11
- 4511 U S 42
- 1675 State Route 529
- 4080 Township Road 138
- 2534 County Road 25
- 5221 County Road 9
- 156 E Williams St
- 176 E Williams St
- 111 E Williams St
- 146 E Williams St
- 107 E Williams St
- 186 E Williams St
- 115 E Williams St Unit F
- 115 E Williams St
- 136 W Williams St
- 136 E Williams St
- 105 E Williams St
- 103 E Williams St
- 102 E Williams St
- 0 Railroad St
- 257 Railroad St
- 343 N Marion St
- 200 E Williams St
- 343 N Marion St
- 237 Railroad St
- 325 N Marion St