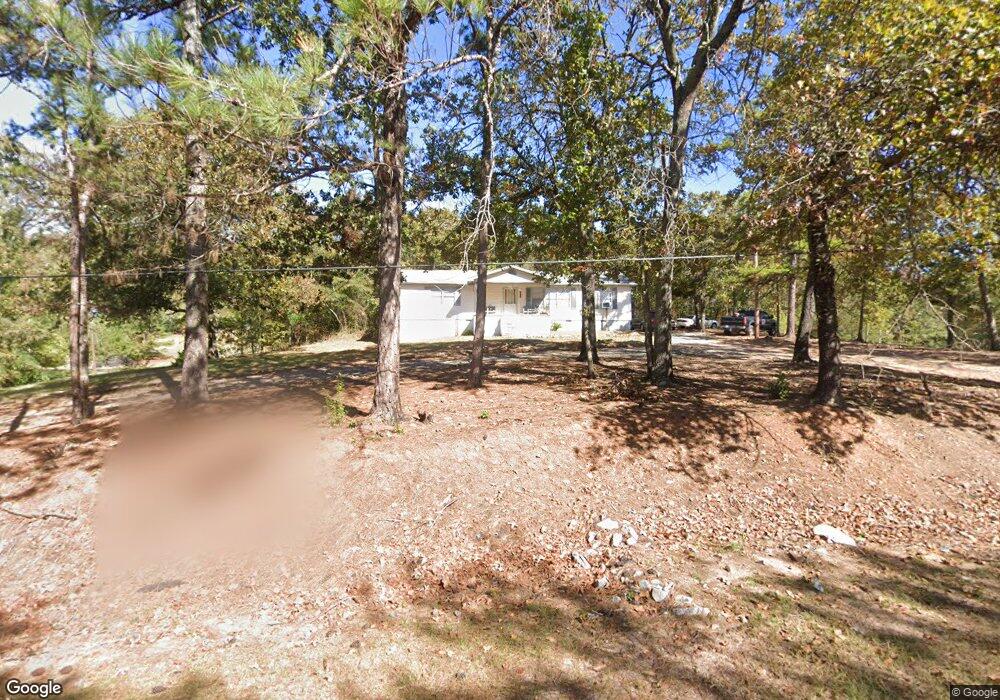
166 Gamble Rd Shiloh, GA 31826
Estimated Value: $150,380 - $500,000
3
Beds
2
Baths
1,664
Sq Ft
$161/Sq Ft
Est. Value
About This Home
This home is located at 166 Gamble Rd, Shiloh, GA 31826 and is currently estimated at $267,127, approximately $160 per square foot. 166 Gamble Rd is a home with nearby schools including Central School.
Ownership History
Date
Name
Owned For
Owner Type
Purchase Details
Closed on
Sep 2, 2015
Sold by
Daniel Annie Lois
Bought by
Daniel Ozell
Current Estimated Value
Purchase Details
Closed on
Nov 22, 2005
Sold by
Collier Daniel Joseph
Bought by
Vonell Daniel Annie L and Vonell Daniel Bond
Purchase Details
Closed on
Aug 31, 2005
Sold by
Collier Daniel Joseph
Bought by
Daniel Annie Lois
Purchase Details
Closed on
Aug 24, 2005
Sold by
Daniel Doshia
Bought by
Daniel Annie Lois
Purchase Details
Closed on
Aug 7, 2005
Sold by
Hall Carolyn Ann
Bought by
Daniel Annie Lois
Purchase Details
Closed on
Aug 4, 2005
Sold by
Tillis Janet Marie
Bought by
Daniel Annie Lois
Purchase Details
Closed on
Jun 10, 2005
Sold by
Ozell Daniel
Bought by
Daniel Annie Lois
Purchase Details
Closed on
Jun 3, 2005
Sold by
Bond Vonell
Bought by
Daniel Annie Lois
Purchase Details
Closed on
May 31, 2005
Sold by
Lavelle Daniel Reginald
Bought by
Daniel Annie Lois
Create a Home Valuation Report for This Property
The Home Valuation Report is an in-depth analysis detailing your home's value as well as a comparison with similar homes in the area
Home Values in the Area
Average Home Value in this Area
Purchase History
| Date | Buyer | Sale Price | Title Company |
|---|---|---|---|
| Daniel Ozell | -- | -- | |
| Vonell Daniel Annie L | -- | -- | |
| Daniel Annie Lois | -- | -- | |
| Daniel Annie Lois | -- | -- | |
| Daniel Annie Lois | -- | -- | |
| Daniel Annie Lois | -- | -- | |
| Daniel Annie Lois | -- | -- | |
| Daniel Annie Lois | -- | -- | |
| Daniel Annie Lois | -- | -- |
Source: Public Records
Tax History
| Year | Tax Paid | Tax Assessment Tax Assessment Total Assessment is a certain percentage of the fair market value that is determined by local assessors to be the total taxable value of land and additions on the property. | Land | Improvement |
|---|---|---|---|---|
| 2025 | $1,309 | $37,856 | $8,224 | $29,632 |
| 2024 | $1,387 | $38,547 | $8,224 | $30,323 |
| 2023 | $1,202 | $33,201 | $8,471 | $24,730 |
| 2022 | $1,055 | $34,258 | $8,471 | $25,787 |
| 2021 | $1,157 | $34,344 | $8,224 | $26,120 |
| 2020 | $1,077 | $31,366 | $8,224 | $23,142 |
| 2019 | $1,081 | $31,498 | $8,224 | $23,274 |
| 2018 | $949 | $31,498 | $8,224 | $23,274 |
| 2017 | $1,079 | $31,498 | $8,224 | $23,274 |
| 2016 | $915 | $25,935 | $4,931 | $21,004 |
| 2015 | -- | $29,012 | $8,008 | $21,004 |
| 2013 | -- | $27,972 | $9,852 | $18,120 |
Source: Public Records
Map
Nearby Homes
- 6900 Scenic Heights
- 731 Jenni Ln
- 709 Jenni Ln
- 7223 Scenic Heights
- 907 Mayes Way
- 921 Mccurdy Blvd
- 825 Mccurdy Blvd
- 815 Mccurdy Blvd
- 604 Farris Blvd
- 617 Mayes Way
- 403 W Broxton Ln
- 514 Farris Blvd
- 1540 Flint Hill Hwy
- 504 Webster Dr
- 2385 Nebula Rd
- 3820 Nebula Rd
- 0 W Main St Unit 228104
- 522 4th St
- 1755 Hunsinger Rd
- 410 W 3rd St
Your Personal Tour Guide
Ask me questions while you tour the home.