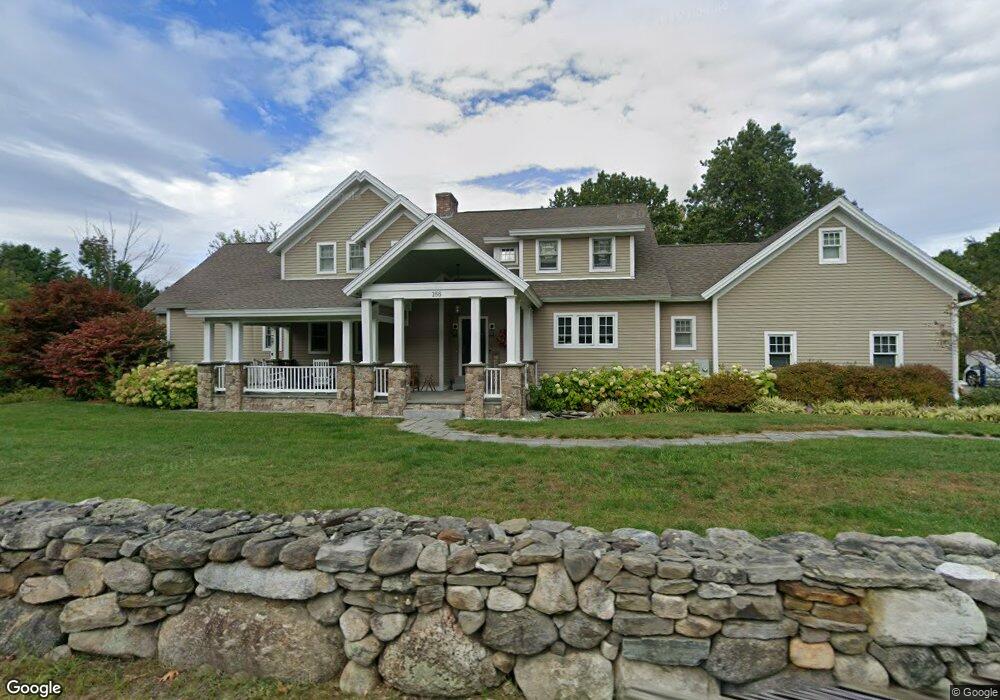
166 High St Unit 1 Dunstable, MA 01827
Estimated Value: $957,000 - $1,312,000
4
Beds
3
Baths
2,778
Sq Ft
$412/Sq Ft
Est. Value
About This Home
This home is located at 166 High St Unit 1, Dunstable, MA 01827 and is currently estimated at $1,145,026, approximately $412 per square foot. 166 High St Unit 1 is a home located in Middlesex County with nearby schools including Groton Dunstable Regional High School and World Academy.
Ownership History
Date
Name
Owned For
Owner Type
Purchase Details
Closed on
Dec 18, 2019
Sold by
Gallant Richard A Est
Bought by
Fairbarn Ryan and Fairbarn Kasie
Current Estimated Value
Home Financials for this Owner
Home Financials are based on the most recent Mortgage that was taken out on this home.
Original Mortgage
$565,250
Outstanding Balance
$498,349
Interest Rate
3.6%
Mortgage Type
New Conventional
Estimated Equity
$646,677
Purchase Details
Closed on
May 29, 2014
Sold by
Gallant Richard A
Bought by
Gallant Richard W and Gallant Susanna H
Purchase Details
Closed on
Dec 31, 2008
Sold by
Gallant Richard W and Gallant Susanna Harper
Bought by
Gallant Richard A
Purchase Details
Closed on
Dec 12, 2002
Sold by
Hencke Deborah E and Hencke Thomas R
Bought by
Gallant Richard W and Gallant Susanna Harper
Purchase Details
Closed on
Aug 24, 1987
Sold by
Cheney Alan E
Bought by
Hencke Thomas R
Create a Home Valuation Report for This Property
The Home Valuation Report is an in-depth analysis detailing your home's value as well as a comparison with similar homes in the area
Home Values in the Area
Average Home Value in this Area
Purchase History
| Date | Buyer | Sale Price | Title Company |
|---|---|---|---|
| Fairbarn Ryan | $665,000 | None Available | |
| Gallant Richard W | -- | -- | |
| Gallant Richard A | -- | -- | |
| Gallant Richard W | $415,000 | -- | |
| Hencke Thomas R | $292,000 | -- |
Source: Public Records
Mortgage History
| Date | Status | Borrower | Loan Amount |
|---|---|---|---|
| Open | Fairbarn Ryan | $565,250 | |
| Previous Owner | Hencke Thomas R | $475,000 | |
| Previous Owner | Hencke Thomas R | $70,000 | |
| Previous Owner | Hencke Thomas R | $133,000 | |
| Previous Owner | Hencke Thomas R | $150,500 |
Source: Public Records
Tax History
| Year | Tax Paid | Tax Assessment Tax Assessment Total Assessment is a certain percentage of the fair market value that is determined by local assessors to be the total taxable value of land and additions on the property. | Land | Improvement |
|---|---|---|---|---|
| 2025 | $14,939 | $1,086,500 | $221,200 | $865,300 |
| 2024 | $14,288 | $1,023,500 | $202,800 | $820,700 |
| 2023 | $14,195 | $948,200 | $202,800 | $745,400 |
| 2022 | $12,793 | $838,900 | $202,800 | $636,100 |
| 2021 | $12,929 | $787,900 | $185,500 | $602,400 |
| 2020 | $12,852 | $763,200 | $185,500 | $577,700 |
| 2019 | $12,447 | $729,600 | $185,500 | $544,100 |
| 2018 | $12,076 | $688,500 | $184,500 | $504,000 |
| 2017 | $11,601 | $681,600 | $184,500 | $497,100 |
| 2016 | $11,067 | $668,700 | $176,300 | $492,400 |
| 2015 | $10,940 | $653,900 | $148,600 | $505,300 |
| 2014 | $10,971 | $695,700 | $190,400 | $505,300 |
Source: Public Records
Map
Nearby Homes
- 0 Lowell St
- 62 Brook St
- 319 Pleasant St
- 6 Green Heron Ln Unit U22
- 38 Georgetown Dr
- 11 Lojko Dr
- 141 Ridge Rd
- 20 Georgetown Dr
- 58 Wilderness Dr
- 1 Doucet Ave
- 77 Wilderness Dr
- 65 Wilderness Dr
- 1 Wilderness Dr
- 4 Wilderness Dr
- 2 Wilderness Dr
- 8 Wilderness Dr
- 79 Wilderness Dr
- 3 Wilderness Dr
- 7 Wilderness Dr
- 6 Wilderness Dr
Your Personal Tour Guide
Ask me questions while you tour the home.