Estimated Value: $238,000 - $295,000
3
Beds
1
Bath
1,521
Sq Ft
$175/Sq Ft
Est. Value
About This Home
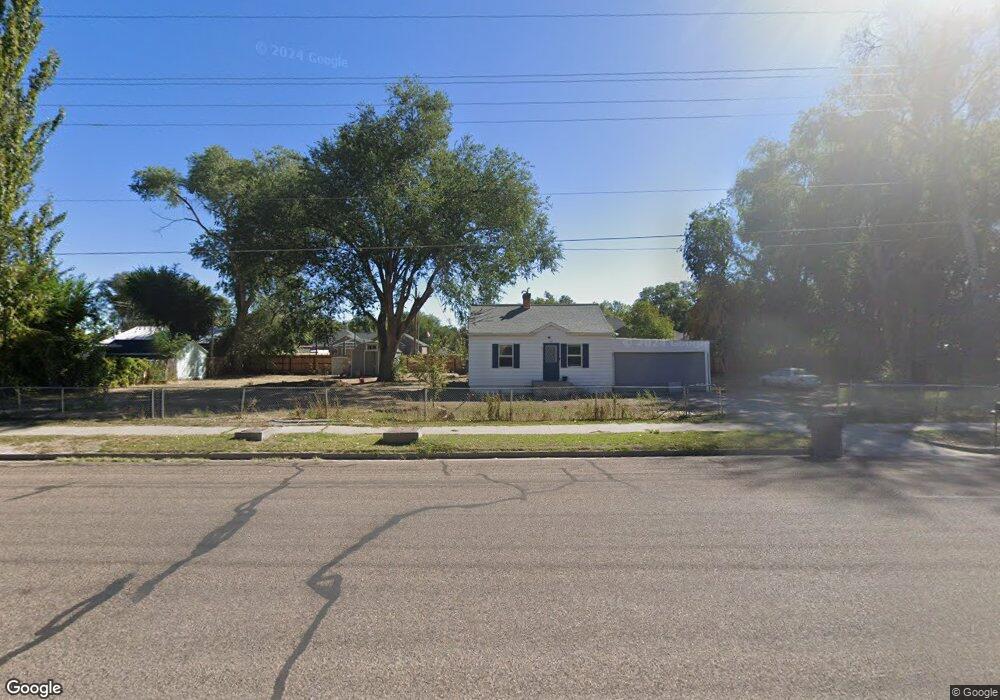
This home is located at 166 N 100 W, Delta, UT 84624 and is currently estimated at $266,500, approximately $175 per square foot. 166 N 100 W is a home located in Millard County with nearby schools including Cba Center and White River Academy.
Ownership History
Date
Name
Owned For
Owner Type
Purchase Details
Closed on
Sep 14, 2023
Sold by
Stoddard Stephen
Bought by
Stephen And Rhoanne Stoddard Family Trust and Stoddard
Current Estimated Value
Purchase Details
Closed on
Dec 6, 2021
Sold by
Richardson Dale Roy and Richardson Shellee Dean
Bought by
Scott Vaughn
Purchase Details
Closed on
Jun 3, 2019
Sold by
Solberg Terry
Bought by
Richardson Dale Roy and Richardson Shellee Dean
Purchase Details
Closed on
Jul 7, 2014
Sold by
Burton L Burton L
Bought by
Solberg Terry
Home Financials for this Owner
Home Financials are based on the most recent Mortgage that was taken out on this home.
Original Mortgage
$73,469
Interest Rate
4.1%
Mortgage Type
Stand Alone First
Create a Home Valuation Report for This Property
The Home Valuation Report is an in-depth analysis detailing your home's value as well as a comparison with similar homes in the area
Home Values in the Area
Average Home Value in this Area
Purchase History
| Date | Buyer | Sale Price | Title Company |
|---|---|---|---|
| Stephen And Rhoanne Stoddard Family Trust | -- | None Listed On Document | |
| Scott Vaughn | -- | First American Title Insuran | |
| Richardson Dale Roy | -- | None Available | |
| Solberg Terry | -- | First American Title Insur |
Source: Public Records
Mortgage History
| Date | Status | Borrower | Loan Amount |
|---|---|---|---|
| Previous Owner | Solberg Terry | $73,469 |
Source: Public Records
Tax History Compared to Growth
Tax History
| Year | Tax Paid | Tax Assessment Tax Assessment Total Assessment is a certain percentage of the fair market value that is determined by local assessors to be the total taxable value of land and additions on the property. | Land | Improvement |
|---|---|---|---|---|
| 2025 | $1,065 | $113,698 | $19,391 | $94,307 |
| 2024 | $1,065 | $91,924 | $13,543 | $78,381 |
| 2023 | $1,152 | $91,924 | $13,543 | $78,381 |
| 2022 | $928 | $69,762 | $14,158 | $55,604 |
| 2021 | $769 | $55,189 | $10,705 | $44,484 |
| 2020 | $705 | $50,270 | $9,732 | $40,538 |
| 2019 | $587 | $41,849 | $9,012 | $32,837 |
| 2018 | $2 | $39,138 | $9,012 | $30,126 |
| 2017 | $2 | $38,875 | $8,749 | $30,126 |
| 2016 | $299 | $38,875 | $8,749 | $30,126 |
| 2015 | $543 | $38,875 | $8,749 | $30,126 |
| 2014 | -- | $35,608 | $9,584 | $26,024 |
| 2013 | -- | $0 | $0 | $0 |
Source: Public Records
Map
Nearby Homes