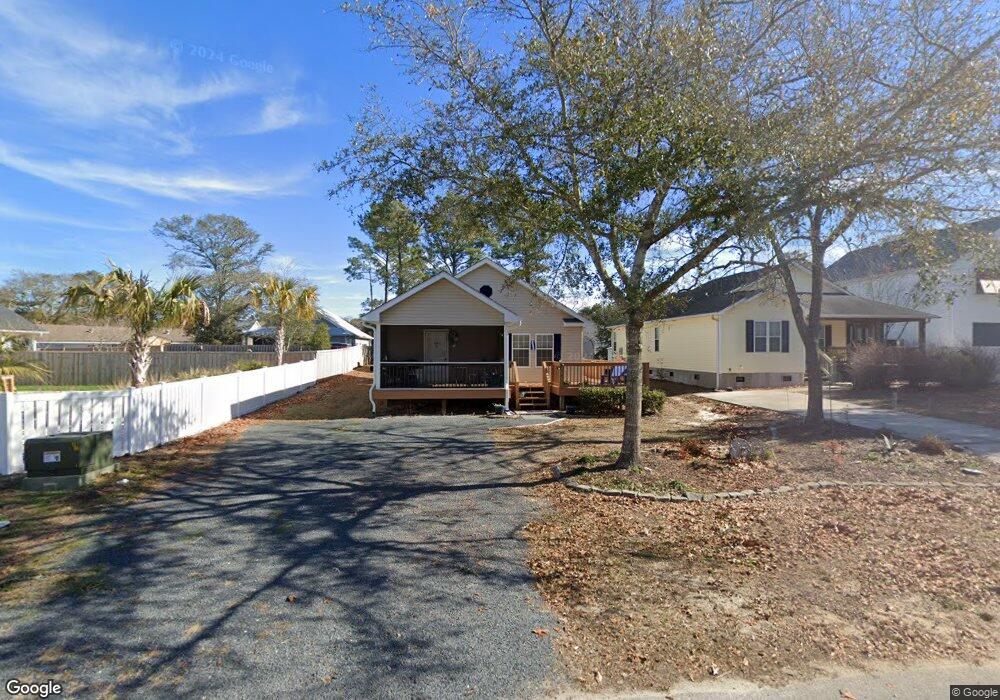
166 NE 5th St Oak Island, NC 28465
Estimated Value: $422,000 - $456,000
3
Beds
2
Baths
1,350
Sq Ft
$329/Sq Ft
Est. Value
About This Home
This home is located at 166 NE 5th St, Oak Island, NC 28465 and is currently estimated at $444,220, approximately $329 per square foot. 166 NE 5th St is a home located in Brunswick County with nearby schools including Southport Elementary School, South Brunswick Middle School, and South Brunswick High School.
Ownership History
Date
Name
Owned For
Owner Type
Purchase Details
Closed on
Oct 16, 2020
Sold by
Davis Jerry Watson and Davis Kaye Deaton
Bought by
Tice Harry David and Tice Penny Kay
Current Estimated Value
Home Financials for this Owner
Home Financials are based on the most recent Mortgage that was taken out on this home.
Original Mortgage
$150,000
Outstanding Balance
$133,417
Interest Rate
2.9%
Mortgage Type
New Conventional
Estimated Equity
$310,803
Purchase Details
Closed on
Jan 5, 2005
Sold by
Herr Rodney E and Herr Diana L
Bought by
Smith Everett and Smith Lynda
Purchase Details
Closed on
Sep 1, 2004
Bought by
Davis Jerry
Create a Home Valuation Report for This Property
The Home Valuation Report is an in-depth analysis detailing your home's value as well as a comparison with similar homes in the area
Home Values in the Area
Average Home Value in this Area
Purchase History
| Date | Buyer | Sale Price | Title Company |
|---|---|---|---|
| Tice Harry David | $250,000 | None Available | |
| Smith Everett | $100,000 | None Available | |
| Davis Jerry | $153,000 | -- |
Source: Public Records
Mortgage History
| Date | Status | Borrower | Loan Amount |
|---|---|---|---|
| Open | Tice Harry David | $150,000 |
Source: Public Records
Tax History Compared to Growth
Tax History
| Year | Tax Paid | Tax Assessment Tax Assessment Total Assessment is a certain percentage of the fair market value that is determined by local assessors to be the total taxable value of land and additions on the property. | Land | Improvement |
|---|---|---|---|---|
| 2025 | $1,604 | $367,590 | $147,000 | $220,590 |
| 2024 | $1,604 | $367,590 | $147,000 | $220,590 |
| 2023 | $1,100 | $367,590 | $147,000 | $220,590 |
| 2022 | $1,100 | $175,330 | $68,000 | $107,330 |
| 2021 | $1,070 | $175,330 | $68,000 | $107,330 |
| 2020 | $1,045 | $175,330 | $68,000 | $107,330 |
| 2019 | $1,045 | $68,670 | $68,000 | $670 |
| 2018 | $807 | $37,810 | $37,000 | $810 |
| 2017 | $807 | $37,810 | $37,000 | $810 |
| 2016 | $782 | $37,810 | $37,000 | $810 |
| 2015 | $782 | $129,900 | $37,000 | $92,900 |
| 2014 | $747 | $134,154 | $45,000 | $89,154 |
Source: Public Records
Map
Nearby Homes