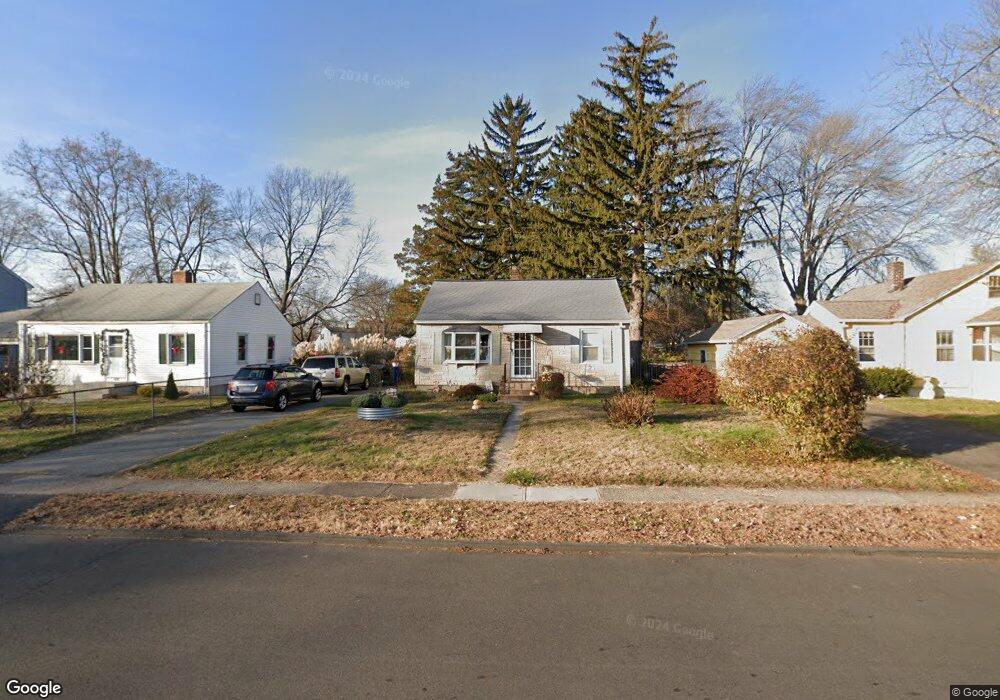
166 Oxford Dr East Hartford, CT 06118
Estimated Value: $264,000 - $298,000
3
Beds
1
Bath
1,188
Sq Ft
$235/Sq Ft
Est. Value
About This Home
This home is located at 166 Oxford Dr, East Hartford, CT 06118 and is currently estimated at $278,791, approximately $234 per square foot. 166 Oxford Dr is a home located in Hartford County with nearby schools including Dr. Thomas S. O'Connell School, East Hartford Middle School, and East Hartford High School.
Ownership History
Date
Name
Owned For
Owner Type
Purchase Details
Closed on
Aug 14, 2001
Sold by
Malgioglio Salvatore and Malgioglio Anthony
Bought by
Driscoll Curtis D and Driscoll Kathryn M
Current Estimated Value
Home Financials for this Owner
Home Financials are based on the most recent Mortgage that was taken out on this home.
Original Mortgage
$96,171
Interest Rate
7.1%
Purchase Details
Closed on
Dec 2, 1992
Sold by
Thibodeau Mark L and Sikorski Theresa F
Bought by
Malgioglio Salvatore and Malgioglio Anthony
Create a Home Valuation Report for This Property
The Home Valuation Report is an in-depth analysis detailing your home's value as well as a comparison with similar homes in the area
Home Values in the Area
Average Home Value in this Area
Purchase History
| Date | Buyer | Sale Price | Title Company |
|---|---|---|---|
| Driscoll Curtis D | $98,000 | -- | |
| Malgioglio Salvatore | $99,000 | -- |
Source: Public Records
Mortgage History
| Date | Status | Borrower | Loan Amount |
|---|---|---|---|
| Closed | Malgioglio Salvatore | $40,718 | |
| Open | Malgioglio Salvatore | $97,613 | |
| Closed | Malgioglio Salvatore | $96,171 | |
| Previous Owner | Malgioglio Salvatore | $6,489 |
Source: Public Records
Tax History Compared to Growth
Tax History
| Year | Tax Paid | Tax Assessment Tax Assessment Total Assessment is a certain percentage of the fair market value that is determined by local assessors to be the total taxable value of land and additions on the property. | Land | Improvement |
|---|---|---|---|---|
| 2025 | $5,626 | $122,560 | $37,700 | $84,860 |
| 2024 | $5,393 | $122,560 | $37,700 | $84,860 |
| 2023 | $5,214 | $122,560 | $37,700 | $84,860 |
| 2022 | $5,025 | $122,560 | $37,700 | $84,860 |
| 2021 | $4,076 | $82,590 | $28,560 | $54,030 |
| 2020 | $4,123 | $82,590 | $28,560 | $54,030 |
| 2019 | $4,056 | $82,590 | $28,560 | $54,030 |
| 2018 | $3,936 | $82,590 | $28,560 | $54,030 |
| 2017 | $3,886 | $82,590 | $28,560 | $54,030 |
| 2016 | $4,016 | $87,570 | $28,560 | $59,010 |
| 2015 | $4,016 | $87,570 | $28,560 | $59,010 |
| 2014 | $3,976 | $87,570 | $28,560 | $59,010 |
Source: Public Records
Map
Nearby Homes