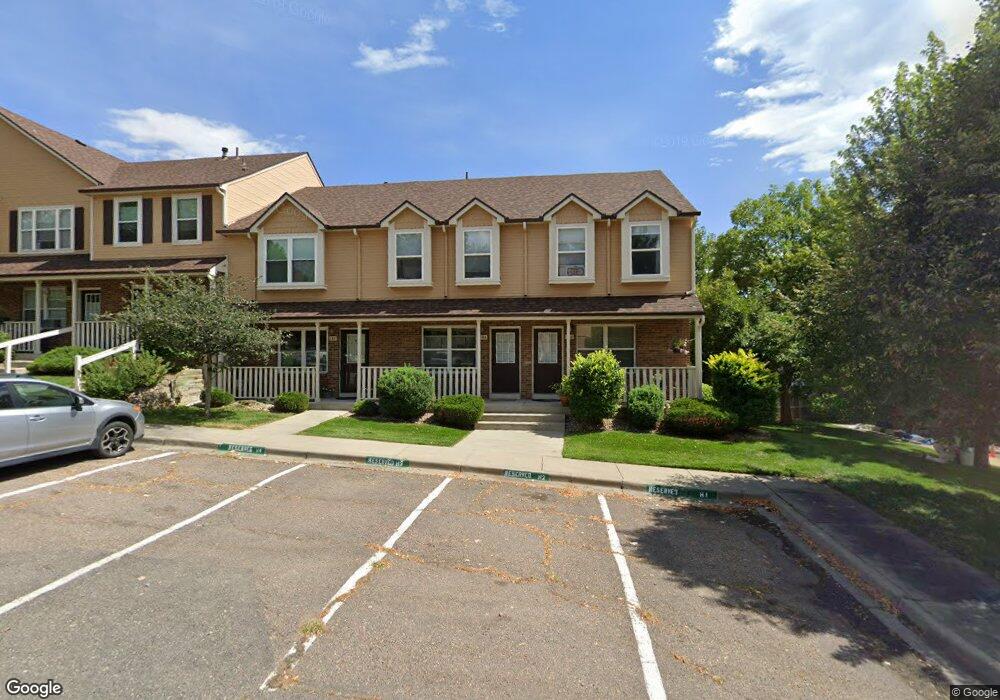
166 Pheasant Run Louisville, CO 80027
Estimated Value: $405,195 - $431,000
2
Beds
2
Baths
1,056
Sq Ft
$395/Sq Ft
Est. Value
About This Home
This home is located at 166 Pheasant Run, Louisville, CO 80027 and is currently estimated at $417,549, approximately $395 per square foot. 166 Pheasant Run is a home located in Boulder County with nearby schools including Coal Creek Elementary School, Louisville Middle School, and Monarch High School.
Ownership History
Date
Name
Owned For
Owner Type
Purchase Details
Closed on
Dec 30, 2013
Sold by
Ayers James E
Bought by
Driver Michael J
Current Estimated Value
Purchase Details
Closed on
Jul 7, 2001
Sold by
Ayers Gwyneth A E and Case James G
Bought by
Ayers James E
Home Financials for this Owner
Home Financials are based on the most recent Mortgage that was taken out on this home.
Original Mortgage
$137,600
Interest Rate
7.18%
Purchase Details
Closed on
Aug 8, 2000
Sold by
Ayers Gwyneth A E
Bought by
Case James G
Home Financials for this Owner
Home Financials are based on the most recent Mortgage that was taken out on this home.
Original Mortgage
$122,000
Interest Rate
8.15%
Purchase Details
Closed on
Jul 26, 1995
Sold by
Mountain Shadows Builders Inc
Bought by
Ayers Gwyneth A E
Create a Home Valuation Report for This Property
The Home Valuation Report is an in-depth analysis detailing your home's value as well as a comparison with similar homes in the area
Home Values in the Area
Average Home Value in this Area
Purchase History
| Date | Buyer | Sale Price | Title Company |
|---|---|---|---|
| Driver Michael J | $185,000 | Heritage Title | |
| Ayers James E | $172,000 | -- | |
| Case James G | -- | -- | |
| Ayers Gwyneth A E | $110,730 | Commonwealth Land Title |
Source: Public Records
Mortgage History
| Date | Status | Borrower | Loan Amount |
|---|---|---|---|
| Previous Owner | Ayers James E | $137,600 | |
| Previous Owner | Case James G | $122,000 |
Source: Public Records
Tax History Compared to Growth
Tax History
| Year | Tax Paid | Tax Assessment Tax Assessment Total Assessment is a certain percentage of the fair market value that is determined by local assessors to be the total taxable value of land and additions on the property. | Land | Improvement |
|---|---|---|---|---|
| 2025 | $2,250 | $28,644 | $8,006 | $20,638 |
| 2024 | $2,250 | $28,644 | $8,006 | $20,638 |
| 2023 | $2,212 | $25,038 | $9,588 | $19,135 |
| 2022 | $2,404 | $24,978 | $7,596 | $17,382 |
| 2021 | $2,380 | $25,697 | $7,815 | $17,882 |
| 2020 | $2,244 | $23,981 | $6,435 | $17,546 |
| 2019 | $2,212 | $23,981 | $6,435 | $17,546 |
| 2018 | $1,895 | $21,211 | $3,312 | $17,899 |
| 2017 | $1,857 | $23,451 | $3,662 | $19,789 |
| 2016 | $1,530 | $17,392 | $4,139 | $13,253 |
| 2015 | $1,450 | $15,371 | $6,209 | $9,162 |
| 2014 | $1,314 | $15,371 | $6,209 | $9,162 |
Source: Public Records
Map
Nearby Homes
- 152 Pheasant Run
- 142 Pheasant Run
- 1615 Cottonwood Dr Unit 9
- 338 Pheasant Run
- 1612 Cottonwood Dr Unit 11W
- 253 W Cedar Way
- 1608 Cottonwood Dr Unit 11
- 357 W Harper St
- 322 W Harper St
- 419 Centennial Dr
- 1610 Longs Peak Dr
- 1420 N Franklin Ct
- 1919 Quail Ct
- 215 Sunland St
- 207 Short Place
- 1655 Main St
- 1851 Gallagher Ln
- 1117 Lincoln Ave
- 1234 Jefferson Ave
- 501 W Linden St
- 162 Pheasant Run
- 168 Pheasant Run
- 160 Pheasant Run
- 160 Pheasant Run Unit LOT 4
- 158 Pheasant Run
- 154 Pheasant Run
- 1815 Regal Ct
- 150 Pheasant Run
- 1867 Regal Ct
- 137 Pheasant Run
- 175 Pheasant Run
- 135 Pheasant Run
- 133 Pheasant Run
- 179 Pheasant Run
- 181 Pheasant Run
- 131 Pheasant Run
- 200 Pheasant Run
- 183 Pheasant Run
- 129 Pheasant Run
- 148 Pheasant Run