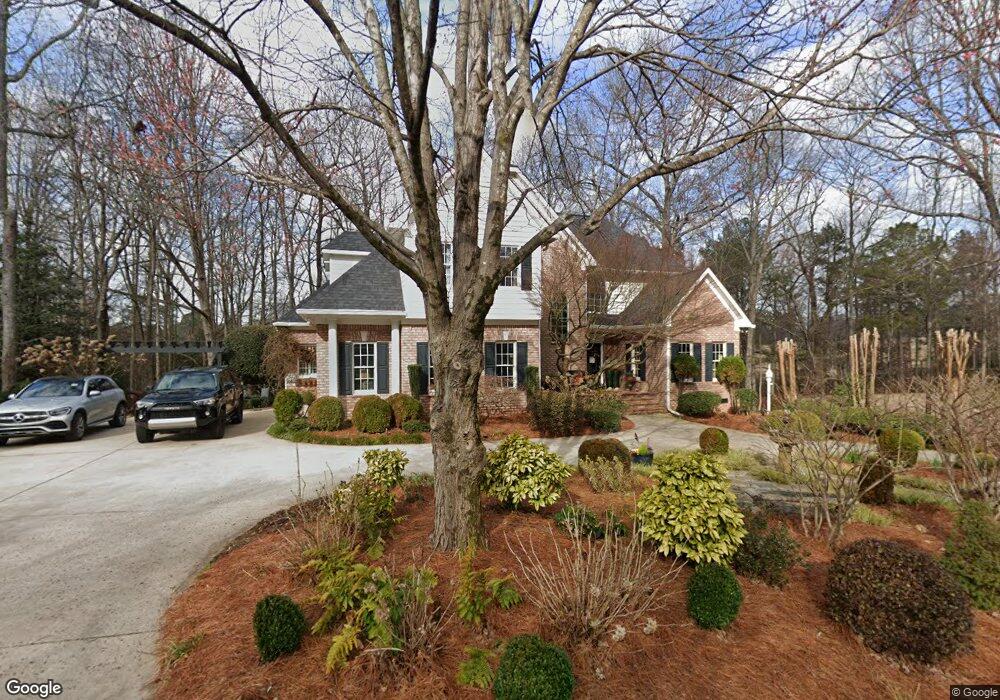
166 River Falls Dr Duncan, SC 29334
Estimated Value: $658,103 - $730,000
4
Beds
5
Baths
4,007
Sq Ft
$172/Sq Ft
Est. Value
About This Home
This home is located at 166 River Falls Dr, Duncan, SC 29334 and is currently estimated at $688,276, approximately $171 per square foot. 166 River Falls Dr is a home located in Spartanburg County with nearby schools including River Ridge Elementary School, Florence Chapel Middle School, and Byrnes Freshman Academy.
Ownership History
Date
Name
Owned For
Owner Type
Purchase Details
Closed on
Nov 11, 2025
Sold by
Martinelli David J and Martinelli Brigitte A
Bought by
David Martinelli Revocable Trust and Brigitte Martinelli Revocable Trust
Current Estimated Value
Purchase Details
Closed on
Feb 1, 2016
Sold by
Martinelli David J
Bought by
Martinelli David J and Martinelli Brigitte A
Purchase Details
Closed on
Mar 25, 2014
Sold by
Branch Banking & Trust Company
Bought by
Martinelli David J
Home Financials for this Owner
Home Financials are based on the most recent Mortgage that was taken out on this home.
Original Mortgage
$283,500
Interest Rate
4.3%
Mortgage Type
New Conventional
Purchase Details
Closed on
Mar 11, 2013
Sold by
Staak Marilyn O
Bought by
Brach Banking & Trust Company
Purchase Details
Closed on
Apr 20, 2004
Sold by
Business Management Services Ltd and Siebert Kenneth
Bought by
Stoak Gary M and Stoak Marilyn O
Purchase Details
Closed on
Feb 9, 2000
Sold by
Staak Gary M and Staak Marilyn O
Bought by
Business Management Services Ltd and Siebert Kenneth
Create a Home Valuation Report for This Property
The Home Valuation Report is an in-depth analysis detailing your home's value as well as a comparison with similar homes in the area
Home Values in the Area
Average Home Value in this Area
Purchase History
| Date | Buyer | Sale Price | Title Company |
|---|---|---|---|
| David Martinelli Revocable Trust | -- | None Listed On Document | |
| Martinelli David J | -- | None Available | |
| Martinelli David J | $315,000 | -- | |
| Brach Banking & Trust Company | $10,000 | -- | |
| Stoak Gary M | -- | -- | |
| Business Management Services Ltd | -- | -- |
Source: Public Records
Mortgage History
| Date | Status | Borrower | Loan Amount |
|---|---|---|---|
| Previous Owner | Martinelli David J | $283,500 |
Source: Public Records
Tax History
| Year | Tax Paid | Tax Assessment Tax Assessment Total Assessment is a certain percentage of the fair market value that is determined by local assessors to be the total taxable value of land and additions on the property. | Land | Improvement |
|---|---|---|---|---|
| 2025 | $2,939 | $20,328 | $2,606 | $17,722 |
| 2023 | $2,939 | $20,328 | $2,606 | $17,722 |
| 2022 | $2,666 | $17,676 | $2,000 | $15,676 |
| 2021 | $2,666 | $17,676 | $2,000 | $15,676 |
| 2020 | $2,622 | $17,676 | $2,000 | $15,676 |
| 2019 | $2,615 | $17,676 | $2,000 | $15,676 |
| 2018 | $2,488 | $17,676 | $2,000 | $15,676 |
| 2017 | $2,344 | $16,928 | $2,000 | $14,928 |
| 2016 | $2,253 | $16,928 | $2,000 | $14,928 |
| 2015 | $2,214 | $16,928 | $2,000 | $14,928 |
| 2014 | $2,228 | $16,928 | $2,000 | $14,928 |
Source: Public Records
Map
Nearby Homes
- 6046 Reidville Rd
- 196 Fair Orchard Way
- 1008 Zinfandel Way
- 652 Mount Vernon Ln
- 1305 S Pinot Rd
- 1301 S Pinot Rd
- 1208 N Pinot Rd
- 1113 Syrah Ln
- 1216 N Pinot Rd
- 470 Drayton Hall Blvd
- 107 Cauthen Ct
- 386 Hague Dr
- 1464 Park Terrace
- 1604 Burtonwood Dr
- 770 Charleston Place
- 150 Santa Ana Way
- 131 Santa Ana Way
- 298 Glen Crest Dr
- 802 Morning Fog Dr
- 237 Penick Dr
- 170 River Falls Dr
- 160 River Falls Dr
- 174 River Falls Dr
- 169 River Falls Dr
- 165 River Falls Dr
- 161 River Falls Dr
- 173 River Falls Dr
- 178 River Falls Dr
- 4 Clubview Ct
- 158 River Falls Dr
- 183 River Falls Dr
- 2 Clubview Ct
- 7 Clubview Ct
- 154 River Falls Dr
- 187 River Falls Dr
- 3 Clubview Ct
- 150 River Falls Dr
- 151 River Falls Dr
- 190 River Falls Dr
- 191 River Falls Dr
Your Personal Tour Guide
Ask me questions while you tour the home.