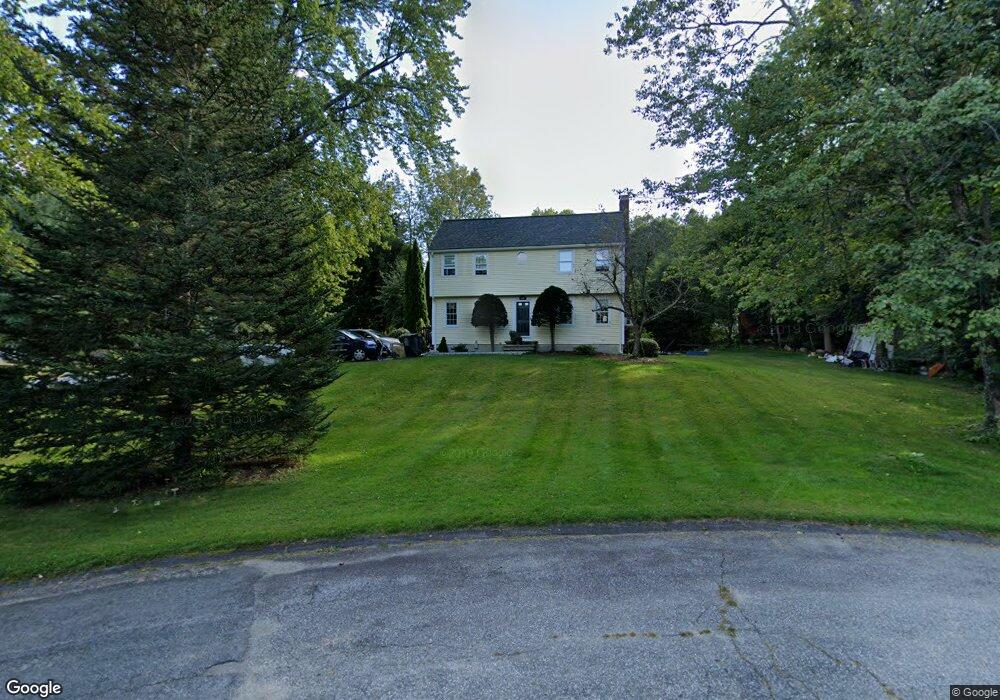
166 Ruby Rd Dracut, MA 01826
Estimated Value: $587,947 - $645,000
3
Beds
2
Baths
1,666
Sq Ft
$366/Sq Ft
Est. Value
About This Home
This home is located at 166 Ruby Rd, Dracut, MA 01826 and is currently estimated at $608,987, approximately $365 per square foot. 166 Ruby Rd is a home located in Middlesex County with nearby schools including Joseph A. Campbell Elementary School, Richardson Middle School, and Dracut Senior High School.
Ownership History
Date
Name
Owned For
Owner Type
Purchase Details
Closed on
Sep 15, 2025
Sold by
Hadley Susan A
Bought by
Lavoie Brian P and Lavoie Amanda L
Current Estimated Value
Home Financials for this Owner
Home Financials are based on the most recent Mortgage that was taken out on this home.
Original Mortgage
$480,000
Outstanding Balance
$477,898
Interest Rate
6.72%
Mortgage Type
New Conventional
Estimated Equity
$131,089
Purchase Details
Closed on
Jul 26, 1988
Sold by
Mcgrath Timothy J
Bought by
Hadley Ronald W
Create a Home Valuation Report for This Property
The Home Valuation Report is an in-depth analysis detailing your home's value as well as a comparison with similar homes in the area
Home Values in the Area
Average Home Value in this Area
Purchase History
| Date | Buyer | Sale Price | Title Company |
|---|---|---|---|
| Lavoie Brian P | $600,000 | -- | |
| Hadley Ronald W | $182,000 | -- |
Source: Public Records
Mortgage History
| Date | Status | Borrower | Loan Amount |
|---|---|---|---|
| Open | Lavoie Brian P | $480,000 | |
| Previous Owner | Hadley Ronald W | $85,000 | |
| Previous Owner | Hadley Ronald W | $110,000 | |
| Previous Owner | Hadley Ronald W | $110,000 | |
| Closed | Hadley Ronald W | $0 |
Source: Public Records
Tax History
| Year | Tax Paid | Tax Assessment Tax Assessment Total Assessment is a certain percentage of the fair market value that is determined by local assessors to be the total taxable value of land and additions on the property. | Land | Improvement |
|---|---|---|---|---|
| 2025 | $5,618 | $555,100 | $251,600 | $303,500 |
| 2024 | $5,420 | $518,700 | $239,700 | $279,000 |
| 2023 | $5,350 | $462,000 | $208,500 | $253,500 |
| 2022 | $5,179 | $421,400 | $189,600 | $231,800 |
| 2021 | $4,992 | $383,700 | $172,200 | $211,500 |
| 2020 | $4,845 | $362,900 | $167,000 | $195,900 |
| 2019 | $4,645 | $337,800 | $159,000 | $178,800 |
| 2018 | $4,724 | $334,100 | $159,000 | $175,100 |
| 2017 | $4,705 | $334,100 | $159,000 | $175,100 |
| 2016 | $4,686 | $315,800 | $159,800 | $156,000 |
| 2015 | $4,548 | $304,600 | $159,800 | $144,800 |
| 2014 | $4,275 | $295,000 | $159,800 | $135,200 |
Source: Public Records
Map
Nearby Homes
- 280 & 290 Spring Rd
- 23 Clough Dr
- 2 S Shore Dr
- 7 Little Island Park
- 37 Summer Hill Rd
- 5 Bailey Rd
- 290 Salem Rd
- 245 Salem Rd
- 298 Salem Rd
- 302 Salem Rd
- Lot 4 Canterbury Rd Unit 4
- 11 Wellesley Dr
- 170 E Richardson Rd
- 18 Stone Castle Dr Unit 76
- 45 Currier Rd
- 25 Newbury Rd
- 6 Newbury Rd
- 6 Newbury Rd Unit M18 B12-16 L7
- 16 Carmel Rd Unit M18 B12-16 L2
- 296 Pelham St
Your Personal Tour Guide
Ask me questions while you tour the home.