Estimated Value: $167,000 - $207,000
--
Bed
--
Bath
1,040
Sq Ft
$183/Sq Ft
Est. Value
About This Home
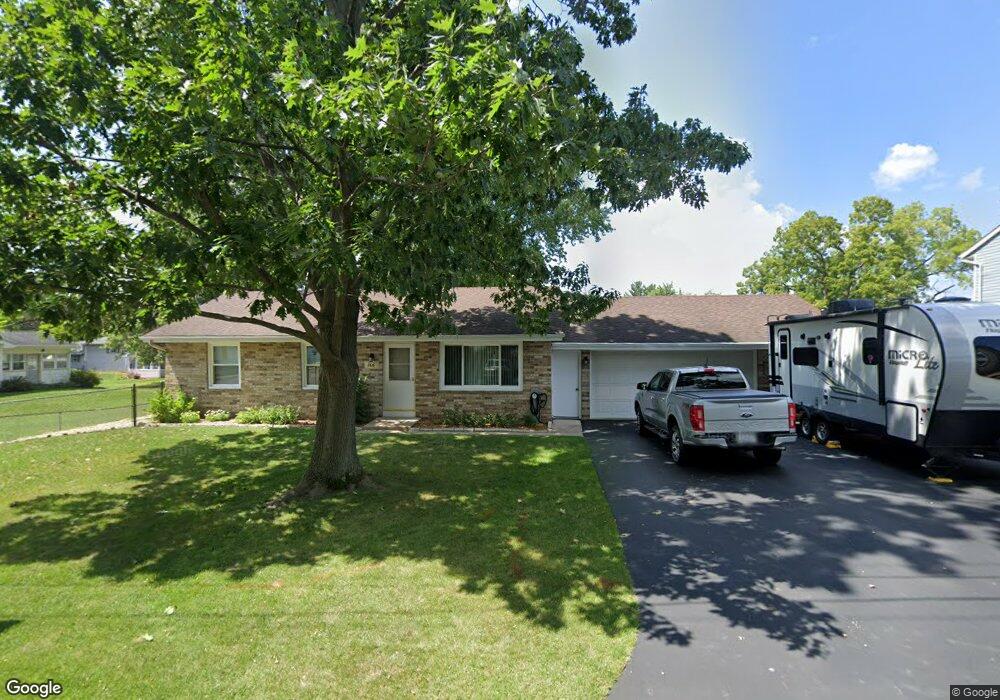
This home is located at 166 S West St, Byron, IL 61010 and is currently estimated at $190,492, approximately $183 per square foot. 166 S West St is a home located in Ogle County with nearby schools including Mary Morgan Elementary School, Byron Middle School, and Byron High School.
Ownership History
Date
Name
Owned For
Owner Type
Purchase Details
Closed on
Feb 13, 2005
Sold by
Leombruni Robert and Leombruni Valerie
Bought by
Clark Deborah M
Current Estimated Value
Home Financials for this Owner
Home Financials are based on the most recent Mortgage that was taken out on this home.
Original Mortgage
$46,000
Interest Rate
6.3%
Mortgage Type
New Conventional
Create a Home Valuation Report for This Property
The Home Valuation Report is an in-depth analysis detailing your home's value as well as a comparison with similar homes in the area
Home Values in the Area
Average Home Value in this Area
Purchase History
| Date | Buyer | Sale Price | Title Company |
|---|---|---|---|
| Clark Deborah M | $125,000 | Security First Title Co |
Source: Public Records
Mortgage History
| Date | Status | Borrower | Loan Amount |
|---|---|---|---|
| Previous Owner | Clark Deborah M | $46,000 |
Source: Public Records
Tax History Compared to Growth
Tax History
| Year | Tax Paid | Tax Assessment Tax Assessment Total Assessment is a certain percentage of the fair market value that is determined by local assessors to be the total taxable value of land and additions on the property. | Land | Improvement |
|---|---|---|---|---|
| 2024 | $3,921 | $51,831 | $9,596 | $42,235 |
| 2023 | $3,649 | $49,274 | $9,123 | $40,151 |
| 2022 | $3,404 | $45,696 | $8,461 | $37,235 |
| 2021 | $3,333 | $43,745 | $8,100 | $35,645 |
| 2020 | $3,065 | $42,887 | $7,941 | $34,946 |
| 2019 | $3,059 | $41,537 | $7,691 | $33,846 |
| 2018 | $3,046 | $40,464 | $7,492 | $32,972 |
| 2017 | $3,015 | $40,464 | $7,492 | $32,972 |
| 2016 | $2,825 | $39,721 | $7,354 | $32,367 |
| 2015 | $2,675 | $38,452 | $7,119 | $31,333 |
| 2014 | $2,647 | $38,452 | $7,119 | $31,333 |
| 2013 | $2,745 | $38,947 | $7,211 | $31,736 |
Source: Public Records
Map
Nearby Homes
- 503 W 2nd St
- 401 W 3rd St
- 423 W 4th St
- 8890 Hales Corner Rd Rd
- 429 N Union St
- 521 N Walnut St
- 265 Creekside Dr
- 309 Creekside Dr
- 1269 E Kysor Rd
- 815 Hampton Dr
- 00 E Ashelford Dr Unit LOT 8
- 00 E Ashelford Dr
- 1245 Glacier Dr
- 1257 Glacier Dr
- 4934 E Ashelford Dr
- 8692 Glacier Dr
- 1368 Joanne Terrace
- 5166 E Hubbard Trail
- 5304 E Hubbard Trail
- 0 N Kishwaukee Rd Lot Unit WP001
- 126 S West St
- 133 S Colfax St
- 527 W Merchant St
- 202 S West St
- 123 S Colfax St
- 203 S Colfax St
- 519 W Merchant St
- 113 S West St
- 208 S West St
- 515 W Merchant St
- 207 S Colfax St
- 212 S West St
- 507 W Merchant St
- 114 S Colfax St
- 130 S Colfax St
- 122 S Colfax St
- 211 S Colfax St
- 213 S West St
- 501 W Merchant St
- 210 S Lafayette St