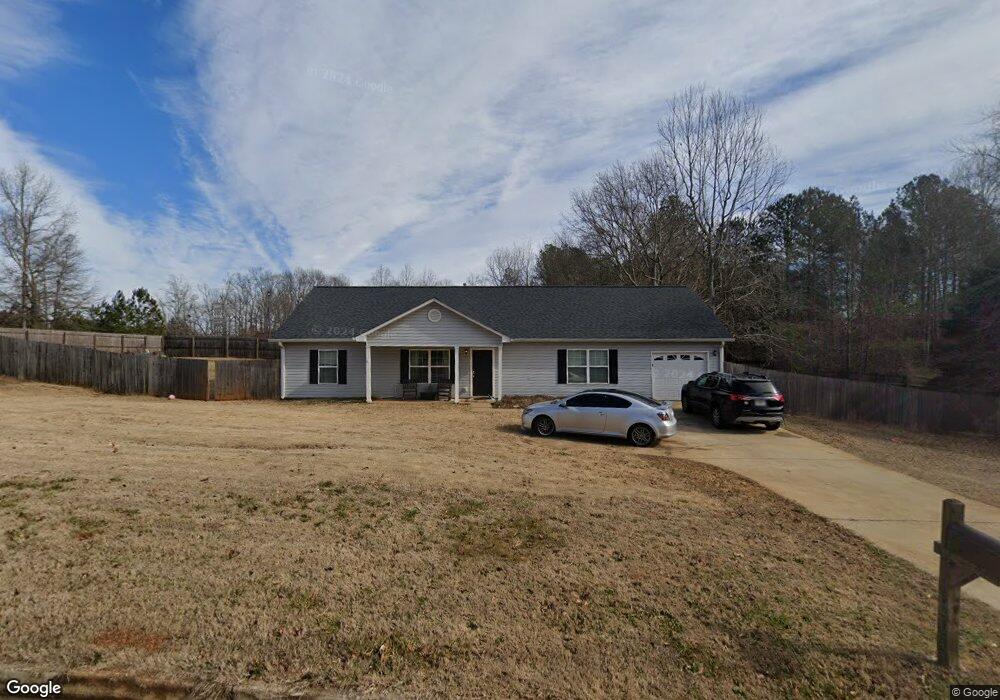
166 Swafford Dr Dallas, GA 30157
Estimated Value: $253,000 - $272,000
3
Beds
2
Baths
1,350
Sq Ft
$196/Sq Ft
Est. Value
About This Home
This home is located at 166 Swafford Dr, Dallas, GA 30157 and is currently estimated at $264,314, approximately $195 per square foot. 166 Swafford Dr is a home located in Paulding County with nearby schools including Union Elementary School, Carl Scoggins Sr. Middle School, and South Paulding High School.
Ownership History
Date
Name
Owned For
Owner Type
Purchase Details
Closed on
Oct 25, 2016
Sold by
Castle Atlanta Holding Lp
Bought by
Tah 2016 1 Borrower Llc
Current Estimated Value
Purchase Details
Closed on
Jan 6, 2015
Sold by
Dunn Charles
Bought by
Castle Atlanta Holding Lp
Purchase Details
Closed on
Dec 20, 2006
Sold by
R & B Const Inc
Bought by
Dunn Charles
Home Financials for this Owner
Home Financials are based on the most recent Mortgage that was taken out on this home.
Original Mortgage
$117,400
Interest Rate
6.06%
Mortgage Type
FHA
Purchase Details
Closed on
Apr 15, 2005
Sold by
Tna Properties Inc
Bought by
R & B Construction Inc
Home Financials for this Owner
Home Financials are based on the most recent Mortgage that was taken out on this home.
Original Mortgage
$90,000
Interest Rate
5.88%
Create a Home Valuation Report for This Property
The Home Valuation Report is an in-depth analysis detailing your home's value as well as a comparison with similar homes in the area
Home Values in the Area
Average Home Value in this Area
Purchase History
| Date | Buyer | Sale Price | Title Company |
|---|---|---|---|
| Tah 2016 1 Borrower Llc | -- | -- | |
| Castle Atlanta Holding Lp | $63,000 | -- | |
| Dunn Charles | $119,400 | -- | |
| R & B Construction Inc | $35,000 | -- |
Source: Public Records
Mortgage History
| Date | Status | Borrower | Loan Amount |
|---|---|---|---|
| Previous Owner | Dunn Charles | $117,400 | |
| Previous Owner | R & B Construction Inc | $90,000 |
Source: Public Records
Tax History Compared to Growth
Tax History
| Year | Tax Paid | Tax Assessment Tax Assessment Total Assessment is a certain percentage of the fair market value that is determined by local assessors to be the total taxable value of land and additions on the property. | Land | Improvement |
|---|---|---|---|---|
| 2024 | $2,378 | $95,584 | $12,000 | $83,584 |
| 2023 | $2,492 | $95,584 | $12,000 | $83,584 |
| 2022 | $1,746 | $66,988 | $12,000 | $54,988 |
| 2021 | $1,834 | $63,100 | $8,000 | $55,100 |
| 2020 | $1,651 | $55,576 | $8,000 | $47,576 |
| 2019 | $1,612 | $53,512 | $8,000 | $45,512 |
| 2018 | $1,440 | $47,792 | $8,000 | $39,792 |
| 2017 | $1,300 | $42,564 | $6,000 | $36,564 |
| 2016 | $762 | $37,356 | $6,000 | $31,356 |
| 2015 | $1,015 | $34,848 | $6,000 | $28,848 |
| 2014 | $691 | $23,740 | $6,000 | $17,740 |
| 2013 | -- | $18,160 | $6,000 | $12,160 |
Source: Public Records
Map
Nearby Homes
- 0 Old Yorkville Rd Unit 10574003
- 370 Buchanan Cir Unit TRACT 1
- 370 Buchanan Circle Tract 1
- 177 Rustin Dr
- 5124 Hulseytown Rd
- 8713 Buchanan Hwy
- 0 Rustin Dr Unit 10617842
- 0 Rustin Dr Unit 7657021
- 363 Safe Harbor Dr
- 128 Tanner Dr
- 8277 Buchanan Hwy
- 19 Safe Harbor Trail
- 877 Georgia 101
- 143 Delane Dr
- 281 Harmony Woods Dr
- 292 Harmony Woods Dr
- 270 Harmony Woods Dr
- 230 Galvin Trail
- 0 Billy Bullock Rd Unit 10622076
- 453 Mulberry Rock Rd
- 159 Swafford Dr
- 177 Swafford Dr
- 140 Swafford Dr Unit 55
- 140 Swafford Dr
- 143 Swafford Dr
- 30 Cynthia Ct
- 30 Cynthia Ct
- 38 Cynthia Ct
- 29 Cynthia Ct
- 31 Cynthia Ct
- 28 Cynthia Ct
- 124 Swafford Dr
- 33 Cynthia Ct
- 32 Cynthia Ct
- 34 Cynthia Ct
- 41 Cynthia Ct
- 121 Swafford Dr
- 42 Cynthia Ct
- 44 Cynthia Ct
- 43 Cynthia Ct