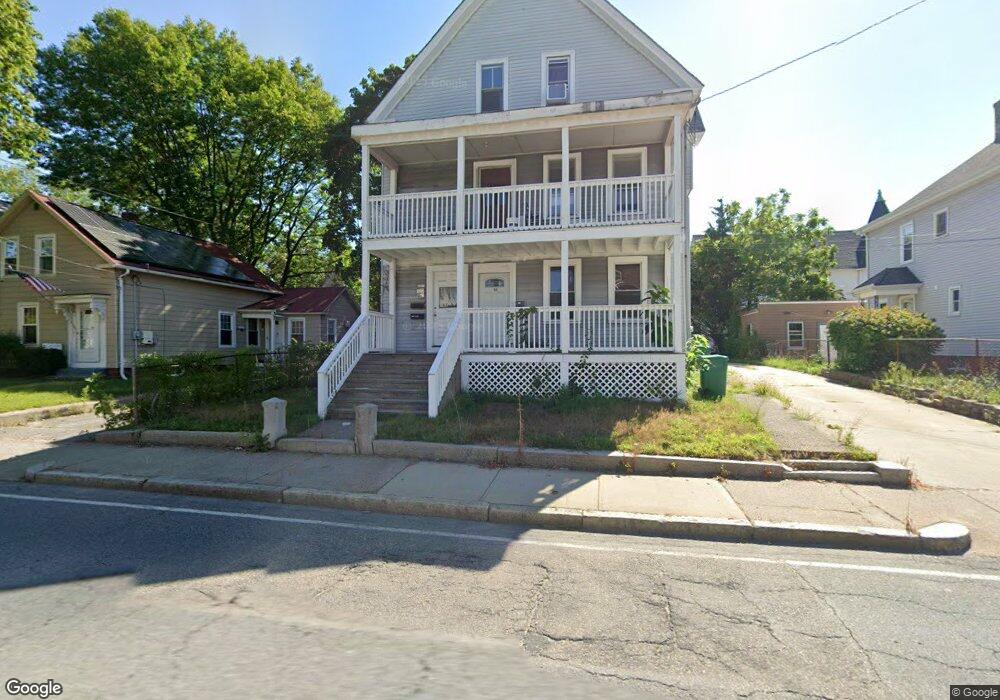
166 Union St Attleboro, MA 02703
Estimated Value: $563,000 - $815,000
8
Beds
3
Baths
3,305
Sq Ft
$206/Sq Ft
Est. Value
About This Home
This home is located at 166 Union St, Attleboro, MA 02703 and is currently estimated at $681,667, approximately $206 per square foot. 166 Union St is a home located in Bristol County with nearby schools including Peter Thacher Elementary School, Cyril K. Brennan Middle School, and Attleboro High School.
Ownership History
Date
Name
Owned For
Owner Type
Purchase Details
Closed on
Aug 14, 2015
Sold by
Warren Thomas L and Warren Elizabeth
Bought by
Cowell Kevin P
Current Estimated Value
Home Financials for this Owner
Home Financials are based on the most recent Mortgage that was taken out on this home.
Original Mortgage
$273,155
Outstanding Balance
$216,428
Interest Rate
4.25%
Mortgage Type
FHA
Estimated Equity
$465,239
Purchase Details
Closed on
Jun 1, 2006
Sold by
Mousseau Gary A
Bought by
Warren Elizabeth and Warren Thomas L
Home Financials for this Owner
Home Financials are based on the most recent Mortgage that was taken out on this home.
Original Mortgage
$262,500
Interest Rate
6.55%
Mortgage Type
Purchase Money Mortgage
Create a Home Valuation Report for This Property
The Home Valuation Report is an in-depth analysis detailing your home's value as well as a comparison with similar homes in the area
Home Values in the Area
Average Home Value in this Area
Purchase History
| Date | Buyer | Sale Price | Title Company |
|---|---|---|---|
| Cowell Kevin P | $254,000 | -- | |
| Warren Elizabeth | $350,000 | -- |
Source: Public Records
Mortgage History
| Date | Status | Borrower | Loan Amount |
|---|---|---|---|
| Open | Cowell Kevin P | $273,155 | |
| Previous Owner | Warren Elizabeth | $262,500 |
Source: Public Records
Tax History Compared to Growth
Tax History
| Year | Tax Paid | Tax Assessment Tax Assessment Total Assessment is a certain percentage of the fair market value that is determined by local assessors to be the total taxable value of land and additions on the property. | Land | Improvement |
|---|---|---|---|---|
| 2025 | $6,103 | $486,300 | $110,300 | $376,000 |
| 2024 | $5,904 | $463,800 | $110,300 | $353,500 |
| 2023 | $5,245 | $383,100 | $100,300 | $282,800 |
| 2022 | $4,789 | $331,400 | $95,500 | $235,900 |
| 2021 | $4,643 | $313,700 | $91,800 | $221,900 |
| 2020 | $4,351 | $298,800 | $89,200 | $209,600 |
| 2019 | $4,119 | $290,900 | $87,400 | $203,500 |
| 2018 | $7,534 | $254,300 | $84,900 | $169,400 |
| 2017 | $3,745 | $257,400 | $84,900 | $172,500 |
| 2016 | $3,299 | $222,600 | $79,300 | $143,300 |
| 2015 | $3,107 | $211,200 | $79,300 | $131,900 |
| 2014 | $2,871 | $193,300 | $75,200 | $118,100 |
Source: Public Records
Map
Nearby Homes