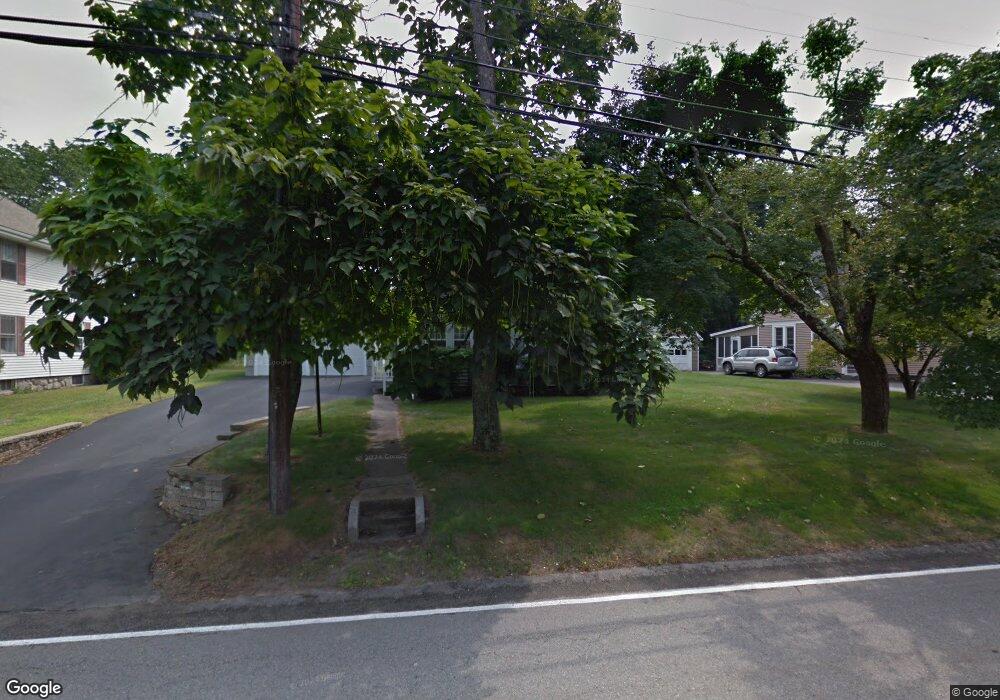
166 West St Walpole, MA 02081
Estimated Value: $622,695 - $711,000
3
Beds
2
Baths
1,558
Sq Ft
$417/Sq Ft
Est. Value
About This Home
This home is located at 166 West St, Walpole, MA 02081 and is currently estimated at $650,424, approximately $417 per square foot. 166 West St is a home located in Norfolk County with nearby schools including Elm Street School, Eleanor N. Johnson Middle School, and Walpole High School.
Ownership History
Date
Name
Owned For
Owner Type
Purchase Details
Closed on
Aug 27, 1998
Sold by
Murphy James H and Murphy Diane M
Bought by
Hall Kathleen F
Current Estimated Value
Home Financials for this Owner
Home Financials are based on the most recent Mortgage that was taken out on this home.
Original Mortgage
$151,300
Outstanding Balance
$32,320
Interest Rate
6.9%
Mortgage Type
Purchase Money Mortgage
Estimated Equity
$618,104
Create a Home Valuation Report for This Property
The Home Valuation Report is an in-depth analysis detailing your home's value as well as a comparison with similar homes in the area
Home Values in the Area
Average Home Value in this Area
Purchase History
| Date | Buyer | Sale Price | Title Company |
|---|---|---|---|
| Hall Kathleen F | $178,000 | -- |
Source: Public Records
Mortgage History
| Date | Status | Borrower | Loan Amount |
|---|---|---|---|
| Open | Hall Kathleen F | $151,300 | |
| Previous Owner | Hall Kathleen F | $40,000 |
Source: Public Records
Tax History
| Year | Tax Paid | Tax Assessment Tax Assessment Total Assessment is a certain percentage of the fair market value that is determined by local assessors to be the total taxable value of land and additions on the property. | Land | Improvement |
|---|---|---|---|---|
| 2025 | $7,008 | $546,200 | $276,800 | $269,400 |
| 2024 | $6,800 | $514,400 | $266,100 | $248,300 |
| 2023 | $6,619 | $476,500 | $231,400 | $245,100 |
| 2022 | $6,222 | $430,300 | $214,300 | $216,000 |
| 2021 | $5,930 | $399,600 | $202,200 | $197,400 |
| 2020 | $5,776 | $385,300 | $180,700 | $204,600 |
| 2019 | $5,519 | $365,500 | $173,800 | $191,700 |
| 2018 | $5,050 | $330,700 | $158,200 | $172,500 |
| 2017 | $4,870 | $317,700 | $152,100 | $165,600 |
| 2016 | $4,696 | $301,800 | $154,800 | $147,000 |
| 2015 | $4,308 | $274,400 | $131,000 | $143,400 |
| 2014 | $4,134 | $262,300 | $131,000 | $131,300 |
Source: Public Records
Map
Nearby Homes
- 26 Drake Cir
- 1110 Main St
- 50 Riverside Place
- 260 Elm St
- 6 Litchfields Way
- 222 School St Unit 9
- 224 School St Unit 9
- 881 Main St Unit 9
- 145 South St Unit 5
- 1391 Main St Unit 308
- 1391 Main St Unit 306
- 1391 Main St Unit 304
- 31 Sandtrap Cir Unit 500
- 10 Sandtrap Cir Unit 2
- 13 Sandtrap Cir Unit 14
- 11 Sandtrap Cir Unit 15
- 20 Sandtrap Cir Unit 4
- 19 Sandtrap Cir Unit 11
- 14 Weathervane Dr Unit 22
- 18 Sandtrap Cir Unit 3
Your Personal Tour Guide
Ask me questions while you tour the home.