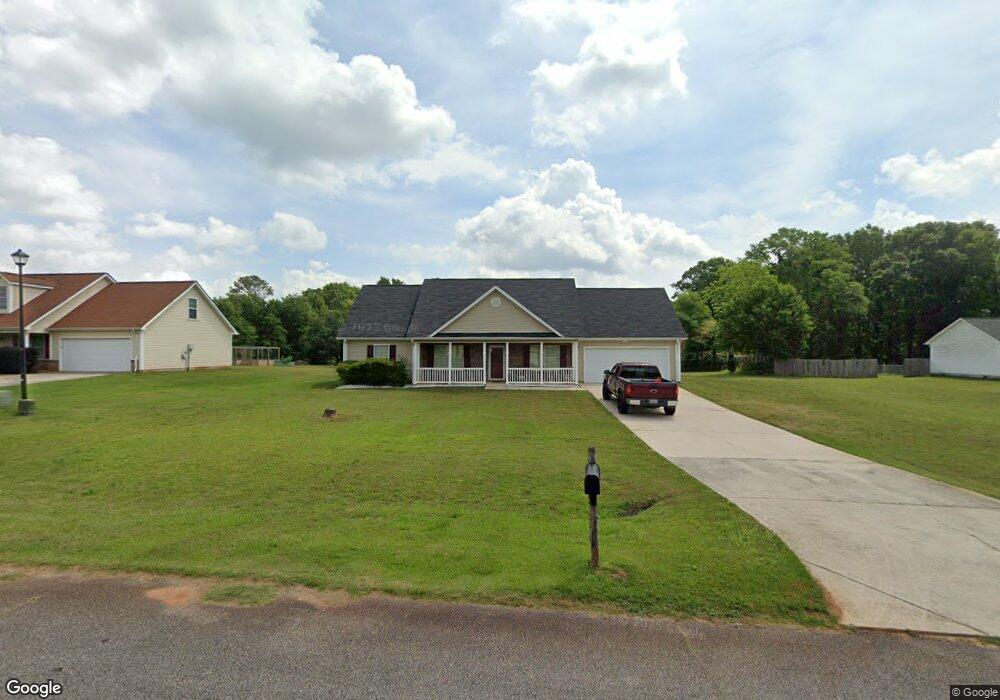
166 Wilder Way Williamson, GA 30292
Spalding County NeighborhoodEstimated Value: $236,000 - $272,000
3
Beds
2
Baths
1,820
Sq Ft
$143/Sq Ft
Est. Value
About This Home
This home is located at 166 Wilder Way, Williamson, GA 30292 and is currently estimated at $260,303, approximately $143 per square foot. 166 Wilder Way is a home located in Spalding County with nearby schools including Moreland Road Elementary School, Carver Road Middle School, and Griffin High School.
Ownership History
Date
Name
Owned For
Owner Type
Purchase Details
Closed on
Aug 19, 2011
Sold by
Federal National Mortgage Association
Bought by
Henderson Horaciso A
Current Estimated Value
Home Financials for this Owner
Home Financials are based on the most recent Mortgage that was taken out on this home.
Original Mortgage
$67,253
Outstanding Balance
$45,977
Interest Rate
4.53%
Mortgage Type
New Conventional
Estimated Equity
$214,326
Purchase Details
Closed on
May 18, 2011
Sold by
Federal Natl Mtg Assn Fnma and Leach Shirley
Bought by
Federal Natl Mtg Assn Fnma
Purchase Details
Closed on
Sep 20, 2004
Sold by
Classic Const & Invest Inc
Bought by
Leach Shirley
Home Financials for this Owner
Home Financials are based on the most recent Mortgage that was taken out on this home.
Original Mortgage
$114,000
Interest Rate
8.5%
Mortgage Type
New Conventional
Create a Home Valuation Report for This Property
The Home Valuation Report is an in-depth analysis detailing your home's value as well as a comparison with similar homes in the area
Home Values in the Area
Average Home Value in this Area
Purchase History
| Date | Buyer | Sale Price | Title Company |
|---|---|---|---|
| Henderson Horaciso A | $64,900 | -- | |
| Federal Natl Mtg Assn Fnma | $1,141,400 | -- | |
| Leach Shirley | $114,000 | -- |
Source: Public Records
Mortgage History
| Date | Status | Borrower | Loan Amount |
|---|---|---|---|
| Open | Henderson Horaciso A | $67,253 | |
| Previous Owner | Leach Shirley | $114,000 |
Source: Public Records
Tax History
| Year | Tax Paid | Tax Assessment Tax Assessment Total Assessment is a certain percentage of the fair market value that is determined by local assessors to be the total taxable value of land and additions on the property. | Land | Improvement |
|---|---|---|---|---|
| 2025 | $3,005 | $85,792 | $6,562 | $79,230 |
| 2024 | $3,030 | $85,792 | $6,976 | $78,816 |
| 2023 | $3,034 | $85,792 | $6,976 | $78,816 |
| 2022 | $2,615 | $85,792 | $8,000 | $77,792 |
| 2021 | $2,405 | $67,131 | $4,000 | $63,131 |
| 2020 | $2,079 | $56,176 | $4,000 | $52,176 |
| 2019 | $1,960 | $51,859 | $4,000 | $47,859 |
| 2018 | $1,869 | $48,144 | $4,000 | $44,144 |
| 2017 | $1,714 | $45,310 | $4,000 | $41,310 |
| 2016 | $1,277 | $32,960 | $4,000 | $28,960 |
| 2015 | $1,393 | $34,983 | $8,000 | $26,983 |
| 2014 | $1,420 | $34,983 | $8,000 | $26,983 |
Source: Public Records
Map
Nearby Homes
- 1621 Rover Zetella Rd
- 1691A Rover Zetella Rd
- 474 N Rover Rd
- 215 Seminary Ridge
- 158 Merrybrook Rd
- 2650 Williamson Rd
- 365 Merrybrook Rd
- 2640 Williamson Rd
- 2630 Williamson Rd
- 2447 Williamson Rd
- 90 & 212 Kendall Dr
- 235 Kendall Dr
- 243 Kendall Dr
- 13 Chappell Hill Rd
- 3465 Newnan Rd
- 90 Rivers Rd
- 0 Newnan Rd Unit 7718043
- 0 Newnan Rd Unit 10689747
- 1763 Robinson Ct
- 1728 Mary Ave
- 168 Wilder Way
- 164 Wilder Way
- 169 Wilder Way
- 170 Wilder Way Unit 3
- 170 Wilder Way
- 172 Wilder Way
- 165 Wilder Way
- 167 Wilder Way
- 162 Wilder Way
- 161 Wilder Way
- 163 Wilder Way
- 160 Wilder Way
- 174 Wilder Way
- 173 Wilder Way
- 159 Wilder Way
- 158 Wilder Way
- 176 Wilder Way
- 157 Wilder Way
- 102 Emanuels Way
- 175 Wilder Way
Your Personal Tour Guide
Ask me questions while you tour the home.