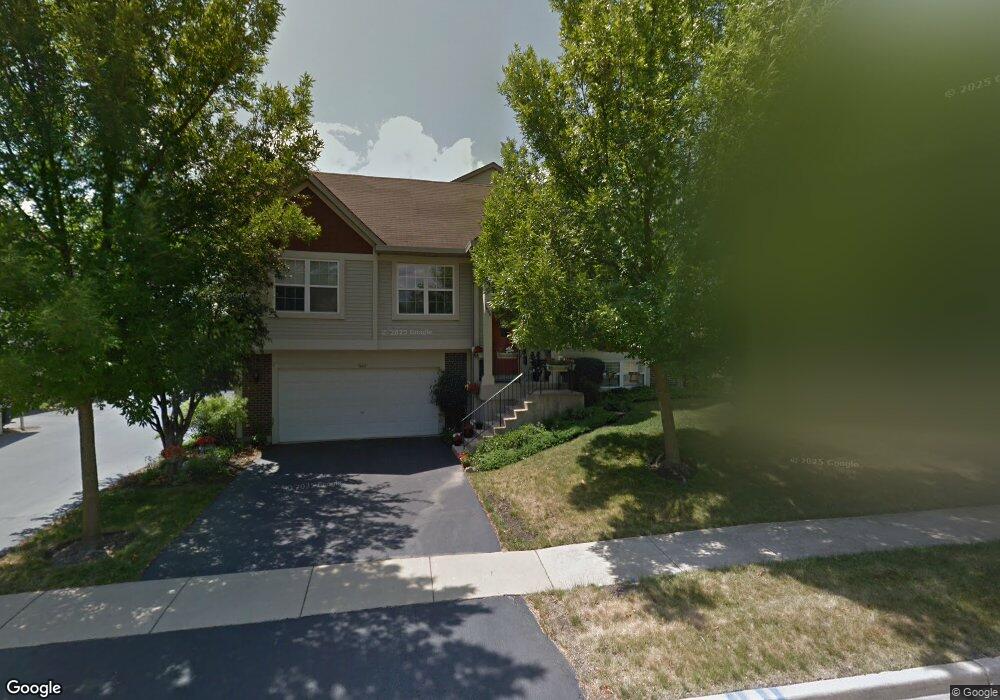
1660 Apple Tree Ln Unit 8 West Chicago, IL 60185
Chicago West NeighborhoodEstimated Value: $251,000 - $288,000
--
Bed
--
Bath
1,096
Sq Ft
$245/Sq Ft
Est. Value
About This Home
This home is located at 1660 Apple Tree Ln Unit 8, West Chicago, IL 60185 and is currently estimated at $268,233, approximately $244 per square foot. 1660 Apple Tree Ln Unit 8 is a home located in DuPage County with nearby schools including Currier Elementary School, Leman Middle School, and West Chicago Community High School.
Ownership History
Date
Name
Owned For
Owner Type
Purchase Details
Closed on
Sep 15, 2018
Sold by
Oelssner Siegfried R and Oelssner Gisela W
Bought by
Paret Richard D
Current Estimated Value
Home Financials for this Owner
Home Financials are based on the most recent Mortgage that was taken out on this home.
Original Mortgage
$165,000
Outstanding Balance
$143,593
Interest Rate
4.5%
Mortgage Type
New Conventional
Estimated Equity
$124,640
Purchase Details
Closed on
Oct 13, 1998
Sold by
Appletree Development Llc
Bought by
Oelssner Siegfried R and Oelssner Gisela W
Home Financials for this Owner
Home Financials are based on the most recent Mortgage that was taken out on this home.
Original Mortgage
$70,000
Interest Rate
6.9%
Mortgage Type
Purchase Money Mortgage
Create a Home Valuation Report for This Property
The Home Valuation Report is an in-depth analysis detailing your home's value as well as a comparison with similar homes in the area
Home Values in the Area
Average Home Value in this Area
Purchase History
| Date | Buyer | Sale Price | Title Company |
|---|---|---|---|
| Paret Richard D | -- | First American Title | |
| Oelssner Siegfried R | $138,000 | -- |
Source: Public Records
Mortgage History
| Date | Status | Borrower | Loan Amount |
|---|---|---|---|
| Open | Paret Richard D | $165,000 | |
| Previous Owner | Oelssner Siegfried R | $70,000 |
Source: Public Records
Tax History Compared to Growth
Tax History
| Year | Tax Paid | Tax Assessment Tax Assessment Total Assessment is a certain percentage of the fair market value that is determined by local assessors to be the total taxable value of land and additions on the property. | Land | Improvement |
|---|---|---|---|---|
| 2024 | $5,156 | $66,066 | $11,376 | $54,690 |
| 2023 | $4,849 | $60,340 | $10,390 | $49,950 |
| 2022 | $4,666 | $55,360 | $9,540 | $45,820 |
| 2021 | $4,482 | $53,060 | $9,140 | $43,920 |
| 2020 | $4,386 | $51,450 | $8,860 | $42,590 |
| 2019 | $4,247 | $49,000 | $8,440 | $40,560 |
| 2018 | $2,444 | $45,380 | $7,820 | $37,560 |
| 2017 | $2,521 | $43,120 | $7,430 | $35,690 |
| 2016 | $2,969 | $40,210 | $6,930 | $33,280 |
| 2015 | $2,815 | $37,220 | $6,410 | $30,810 |
| 2014 | $2,709 | $36,130 | $6,220 | $29,910 |
| 2013 | $3,016 | $37,450 | $6,450 | $31,000 |
Source: Public Records
Map
Nearby Homes
- 1350 Sarana Ave
- 264 Augusta Ave
- Lot 1 Wycliffe Dr
- 29W139 Barnes Ave
- 821 Bishop St
- 29W034 Lester St
- 28W605 Barnes Ave
- 1S221 N Flanders Ln
- 28W659 Lester St
- 30W023 Cedar Ct Unit 23
- 30W013 Juniper Ct
- 30W015 Juniper Ct
- 1S150 Cantigny Dr
- 30W088 Penny Ln
- 30W073 Penny Ln
- 2S002 Ascot Ln Unit 1
- 27W773 Beecher Ave
- 29W715 Branch Ave
- 2S030 Essex Ln
- 2S283 Illinois Route 59
- 1662 Apple Tree Ln Unit 7
- 1664 Apple Tree Ln Unit 6
- 1666 Apple Tree Ln Unit 5
- 1672 Apple Tree Ln Unit 3
- 1650 Apple Tree Ln Unit 12
- 1670 Apple Tree Ln Unit 4
- 1654 Apple Tree Ln Unit 10
- 1676 Apple Tree Ln
- 1674 Apple Tree Ln Unit 2
- 1652 Apple Tree Ln
- 1661 Apple Tree Ln Unit 17
- 1663 Apple Tree Ln Unit 18
- 1656 Apple Tree Ln
- 1651 Apple Tree Ln Unit 21
- 1665 Apple Tree Ln
- 1653 Apple Tree Ln Unit 22
- 1667 Apple Tree Ln Unit 20
- 1646 Apple Tree Ln
- 1655 Apple Tree Ln Unit 23
- 1657 Apple Tree Ln Unit 24