Estimated Value: $228,000 - $258,000
3
Beds
2
Baths
1,472
Sq Ft
$167/Sq Ft
Est. Value
About This Home
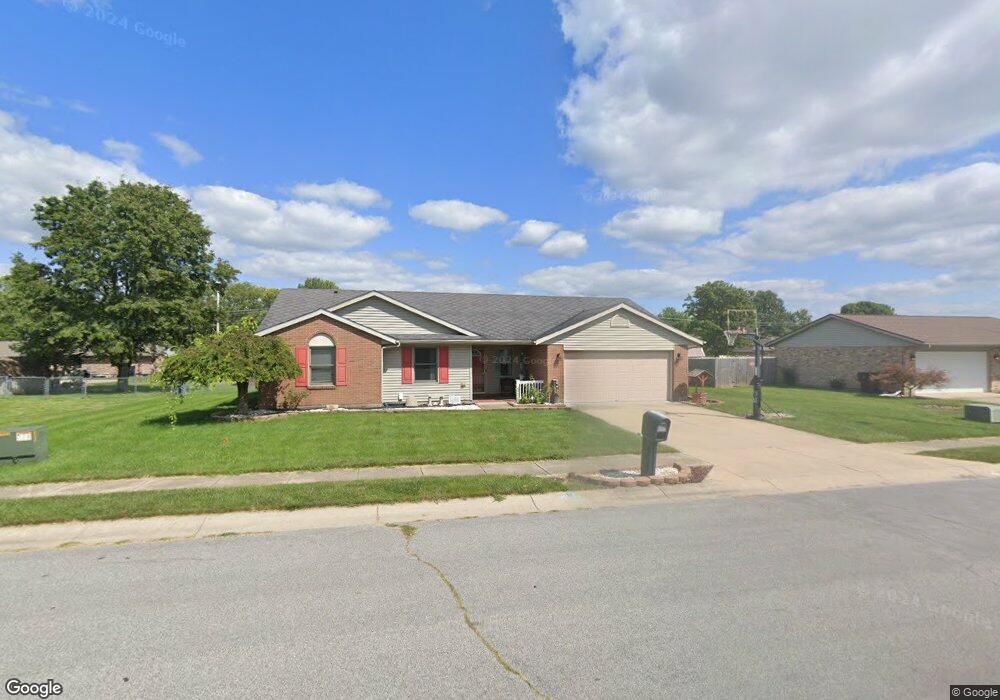
This home is located at 1660 Redbud Ln, Eaton, OH 45320 and is currently estimated at $245,258, approximately $166 per square foot. 1660 Redbud Ln is a home located in Preble County with nearby schools including William Bruce Elementary School, Hollingsworth East Elementary School, and Eaton Middle School.
Ownership History
Date
Name
Owned For
Owner Type
Purchase Details
Closed on
Sep 23, 2022
Sold by
Stacy Josephine R
Bought by
Stacy Josephine R and Hudgel Christoffer Thomas
Current Estimated Value
Purchase Details
Closed on
May 31, 2006
Sold by
Beeghly Eric J and Beeghly Jennifer A
Bought by
Hudgel Thomas L and Hudgel Josephine R
Home Financials for this Owner
Home Financials are based on the most recent Mortgage that was taken out on this home.
Original Mortgage
$127,500
Interest Rate
6.62%
Mortgage Type
Purchase Money Mortgage
Purchase Details
Closed on
May 1, 2000
Sold by
Frizzell Const Inc
Bought by
Beeghly Eric J and Beeghly Jennifer
Home Financials for this Owner
Home Financials are based on the most recent Mortgage that was taken out on this home.
Original Mortgage
$110,072
Interest Rate
8.24%
Mortgage Type
FHA
Create a Home Valuation Report for This Property
The Home Valuation Report is an in-depth analysis detailing your home's value as well as a comparison with similar homes in the area
Home Values in the Area
Average Home Value in this Area
Purchase History
| Date | Buyer | Sale Price | Title Company |
|---|---|---|---|
| Stacy Josephine R | -- | -- | |
| Stacy Josephine R | -- | None Listed On Document | |
| Hudgel Thomas L | $127,500 | None Available | |
| Beeghly Eric J | $111,000 | -- |
Source: Public Records
Mortgage History
| Date | Status | Borrower | Loan Amount |
|---|---|---|---|
| Previous Owner | Hudgel Thomas L | $127,500 | |
| Previous Owner | Beeghly Eric J | $110,072 |
Source: Public Records
Tax History Compared to Growth
Tax History
| Year | Tax Paid | Tax Assessment Tax Assessment Total Assessment is a certain percentage of the fair market value that is determined by local assessors to be the total taxable value of land and additions on the property. | Land | Improvement |
|---|---|---|---|---|
| 2024 | $2,297 | $64,130 | $8,300 | $55,830 |
| 2023 | $2,297 | $64,130 | $8,300 | $55,830 |
| 2022 | $2,187 | $50,400 | $5,670 | $44,730 |
| 2021 | $2,243 | $50,400 | $5,670 | $44,730 |
| 2020 | $2,157 | $50,400 | $5,670 | $44,730 |
| 2019 | $1,835 | $42,180 | $4,660 | $37,520 |
| 2018 | $1,892 | $42,180 | $4,660 | $37,520 |
| 2017 | $768 | $42,180 | $4,660 | $37,520 |
| 2016 | $1,536 | $36,790 | $4,520 | $32,270 |
| 2014 | $755 | $36,790 | $4,520 | $32,270 |
| 2013 | $1,628 | $38,500 | $4,515 | $33,985 |
Source: Public Records
Map
Nearby Homes
- Aldridge Plan at Georgetown Village
- Harmony Plan at Georgetown Village
- Newcastle Plan at Georgetown Village
- 105 Arlington Dr
- 104 Martha Ct
- 113 Arlington Dr
- 101 Martha Ct
- 108 Martha Ct
- 109 Martha Ct
- 125 Arlington Dr
- 1405 Judy Ave
- 0 East Ave
- 217 Miller Ave
- 1302 Aukerman St
- 3525 U S 127
- 519 Romadoor Ave Unit 520
- 1008 N Maple St
- 401 Romadoor Ave Unit 511 (BLDG 12)
- 130 E Chicago St
- 105 Leatherman Place