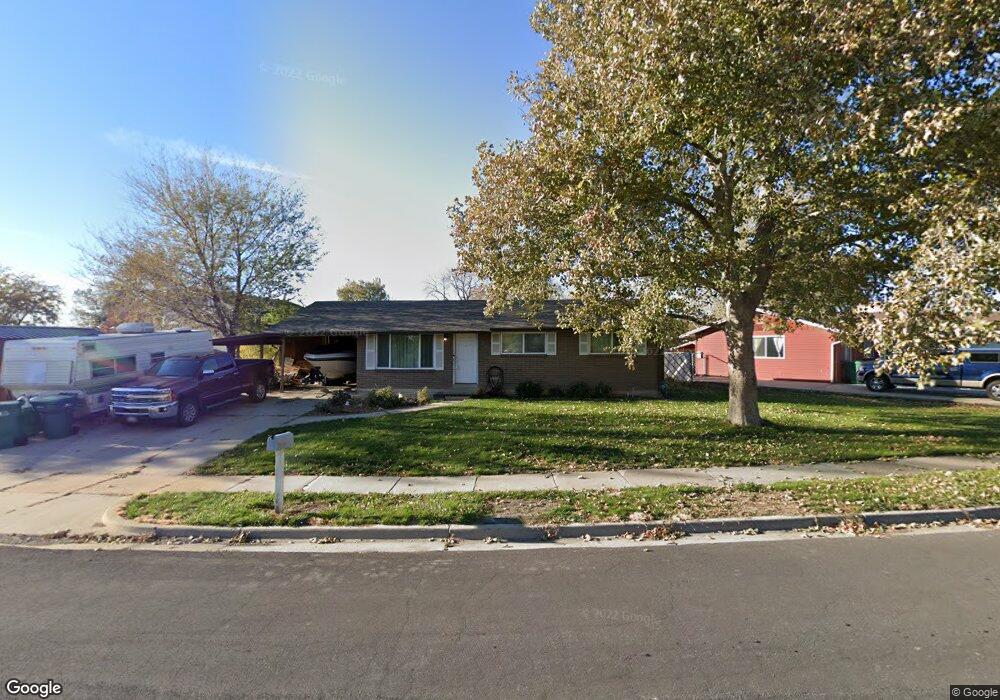
1660 W 1850 N Layton, UT 84041
Estimated Value: $393,000 - $438,000
4
Beds
2
Baths
2,014
Sq Ft
$206/Sq Ft
Est. Value
About This Home
This home is located at 1660 W 1850 N, Layton, UT 84041 and is currently estimated at $415,316, approximately $206 per square foot. 1660 W 1850 N is a home located in Davis County with nearby schools including Vae View Elementary School, North Layton Junior High School, and Northridge High School.
Ownership History
Date
Name
Owned For
Owner Type
Purchase Details
Closed on
Jun 28, 2012
Sold by
Dallof Brad
Bought by
Dallof Bradley W and Dallof Jolene
Current Estimated Value
Home Financials for this Owner
Home Financials are based on the most recent Mortgage that was taken out on this home.
Original Mortgage
$85,000
Outstanding Balance
$58,659
Interest Rate
3.74%
Mortgage Type
New Conventional
Estimated Equity
$356,657
Purchase Details
Closed on
May 5, 2003
Sold by
Federal National Mortgage Association
Bought by
Dallof Brad
Home Financials for this Owner
Home Financials are based on the most recent Mortgage that was taken out on this home.
Original Mortgage
$93,286
Interest Rate
5.72%
Purchase Details
Closed on
Jan 14, 2003
Sold by
Pelca Donald D and Pelca Kim K
Bought by
Federal National Mortgage Association
Purchase Details
Closed on
Sep 17, 2002
Sold by
Pelca Donald D and Pelca Kim K
Bought by
Canyon View Escrow Llc
Create a Home Valuation Report for This Property
The Home Valuation Report is an in-depth analysis detailing your home's value as well as a comparison with similar homes in the area
Home Values in the Area
Average Home Value in this Area
Purchase History
| Date | Buyer | Sale Price | Title Company |
|---|---|---|---|
| Dallof Bradley W | -- | Gt Title Services Salt | |
| Dallof Brad | $93,286 | Us Title | |
| Federal National Mortgage Association | $88,814 | First American Title Co | |
| Canyon View Escrow Llc | -- | -- |
Source: Public Records
Mortgage History
| Date | Status | Borrower | Loan Amount |
|---|---|---|---|
| Open | Dallof Bradley W | $85,000 | |
| Closed | Dallof Brad | $93,286 |
Source: Public Records
Tax History Compared to Growth
Tax History
| Year | Tax Paid | Tax Assessment Tax Assessment Total Assessment is a certain percentage of the fair market value that is determined by local assessors to be the total taxable value of land and additions on the property. | Land | Improvement |
|---|---|---|---|---|
| 2025 | $1,965 | $206,250 | $112,593 | $93,657 |
| 2024 | $1,914 | $202,400 | $134,239 | $68,161 |
| 2023 | $1,856 | $346,000 | $168,950 | $177,050 |
| 2022 | $2,000 | $202,400 | $80,639 | $121,761 |
| 2021 | $1,901 | $287,000 | $116,767 | $170,233 |
| 2020 | $1,616 | $234,000 | $87,108 | $146,892 |
| 2019 | $1,608 | $228,000 | $83,760 | $144,240 |
| 2018 | $1,391 | $198,000 | $77,556 | $120,444 |
| 2016 | $1,209 | $88,770 | $21,754 | $67,016 |
| 2015 | $1,180 | $82,280 | $20,666 | $61,614 |
| 2014 | $1,239 | $88,375 | $20,666 | $67,709 |
| 2013 | -- | $72,128 | $18,612 | $53,516 |
Source: Public Records
Map
Nearby Homes
- 1900 N 1690 W
- 1748 N 1600 W
- 1740 N 1600 W Unit 116
- 1650 N Main St Unit 126
- 1692 N 1600 W
- 1688 N 1600 W Unit 125
- 1682 N 1600 W
- Highbridge 3 Plan at Layton Towns on Main - Townhomes
- Highbridge 1 Plan at Layton Towns on Main - Townhomes
- Midtown Plan at Layton Towns on Main - Townhomes
- Cityline 1 Plan at Layton Towns on Main - Townhomes
- Cityline 2 Plan at Layton Towns on Main - Townhomes
- 1678 N 1600 W
- 1668 N 1600 W
- 1664 N 1600 W
- 1606 W 1960 N
- 1654 N 1600 W
- 1652 N 1600 St W
- 1598 N Main St
- 1591 N Marilyn Dr