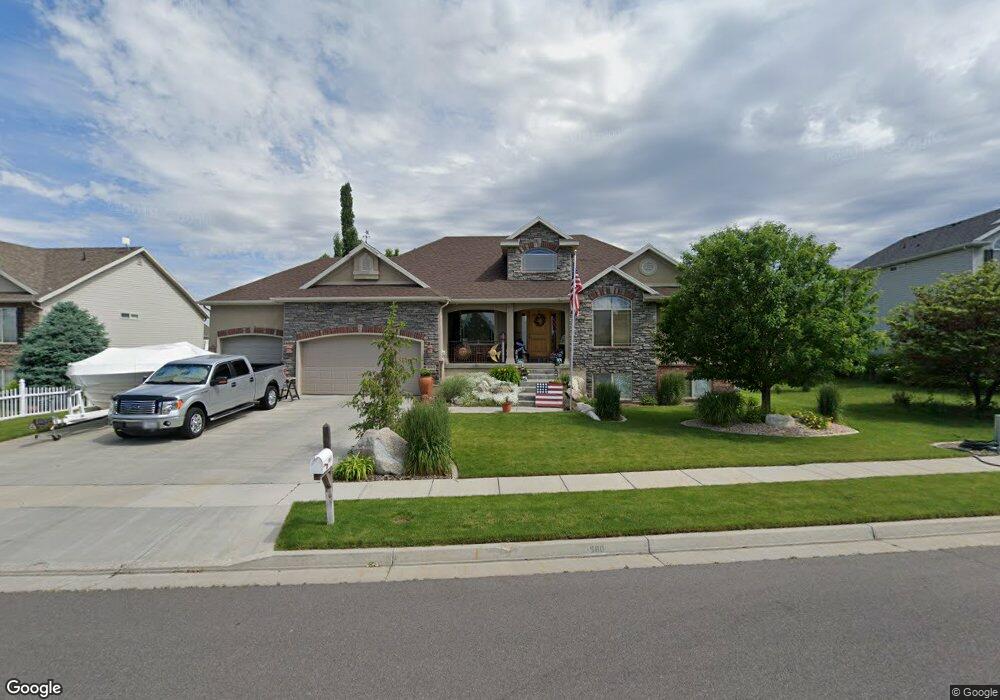
1660 W 2175 S Syracuse, UT 84075
Estimated Value: $570,000 - $630,000
5
Beds
2
Baths
3,018
Sq Ft
$197/Sq Ft
Est. Value
About This Home
This home is located at 1660 W 2175 S, Syracuse, UT 84075 and is currently estimated at $595,459, approximately $197 per square foot. 1660 W 2175 S is a home located in Davis County with nearby schools including Cook School, Syracuse Junior High School, and Syracuse High School.
Ownership History
Date
Name
Owned For
Owner Type
Purchase Details
Closed on
Aug 10, 2020
Sold by
Turner Michael K
Bought by
Turner Michael K and Tumer Kimberly Tula
Current Estimated Value
Home Financials for this Owner
Home Financials are based on the most recent Mortgage that was taken out on this home.
Original Mortgage
$275,000
Outstanding Balance
$243,395
Interest Rate
3%
Mortgage Type
New Conventional
Estimated Equity
$352,064
Purchase Details
Closed on
Oct 17, 2008
Sold by
Turner Michael Kim and Turner Kimberley
Bought by
Turner Michael K
Home Financials for this Owner
Home Financials are based on the most recent Mortgage that was taken out on this home.
Original Mortgage
$247,500
Interest Rate
5.9%
Mortgage Type
New Conventional
Purchase Details
Closed on
Jul 28, 2004
Sold by
Turner Michael Kim
Bought by
Turner Michael Kim and Turner Kimberley
Purchase Details
Closed on
Jul 16, 2004
Sold by
Nilson & Co Inc
Bought by
Turner Michael Kim
Create a Home Valuation Report for This Property
The Home Valuation Report is an in-depth analysis detailing your home's value as well as a comparison with similar homes in the area
Home Values in the Area
Average Home Value in this Area
Purchase History
| Date | Buyer | Sale Price | Title Company |
|---|---|---|---|
| Turner Michael K | -- | Us Title Company Of U | |
| Turner Michael K | -- | First American Title | |
| Turner Michael Kim | -- | First American Title Co | |
| Turner Michael Kim | -- | Bonneville Title Company Inc |
Source: Public Records
Mortgage History
| Date | Status | Borrower | Loan Amount |
|---|---|---|---|
| Open | Turner Michael K | $275,000 | |
| Closed | Turner Michael K | $247,500 |
Source: Public Records
Tax History
| Year | Tax Paid | Tax Assessment Tax Assessment Total Assessment is a certain percentage of the fair market value that is determined by local assessors to be the total taxable value of land and additions on the property. | Land | Improvement |
|---|---|---|---|---|
| 2025 | $3,050 | $294,250 | $125,648 | $168,602 |
| 2024 | $3,063 | $297,550 | $104,571 | $192,979 |
| 2023 | $2,949 | $522,000 | $145,669 | $376,331 |
| 2022 | $3,163 | $306,900 | $83,763 | $223,137 |
| 2021 | $2,823 | $424,000 | $123,858 | $300,142 |
| 2020 | $2,531 | $368,000 | $107,567 | $260,433 |
| 2019 | $2,445 | $351,000 | $105,541 | $245,459 |
| 2018 | $2,281 | $325,000 | $101,715 | $223,285 |
| 2016 | $2,034 | $152,020 | $39,026 | $112,994 |
| 2015 | $1,994 | $141,900 | $39,026 | $102,874 |
| 2014 | $1,800 | $130,526 | $39,026 | $91,500 |
| 2013 | -- | $127,386 | $32,848 | $94,538 |
Source: Public Records
Map
Nearby Homes
- 1996 S 1675 W
- 2013 S 1575 W
- 1686 W 2425 S
- 1826 W 2350 S
- 1876 W 2400 S
- 2356 S 1230 W
- 2104 W 2200 S
- 2366 S 1230 W
- 1196 W 2325 S
- 1782 W 1700 S
- 2138 Craig Ln
- 1876 S 1230 W
- 1156 W 2325 S
- 1653 W 2700 S Unit 218
- 1643 W 2700 S Unit 216
- 2742 S Allison Way Unit 212
- 1116 W 2325 S
- 1137 2275 S
- 2721 S Allison Way
- 1168 W Tivoli Way
Your Personal Tour Guide
Ask me questions while you tour the home.