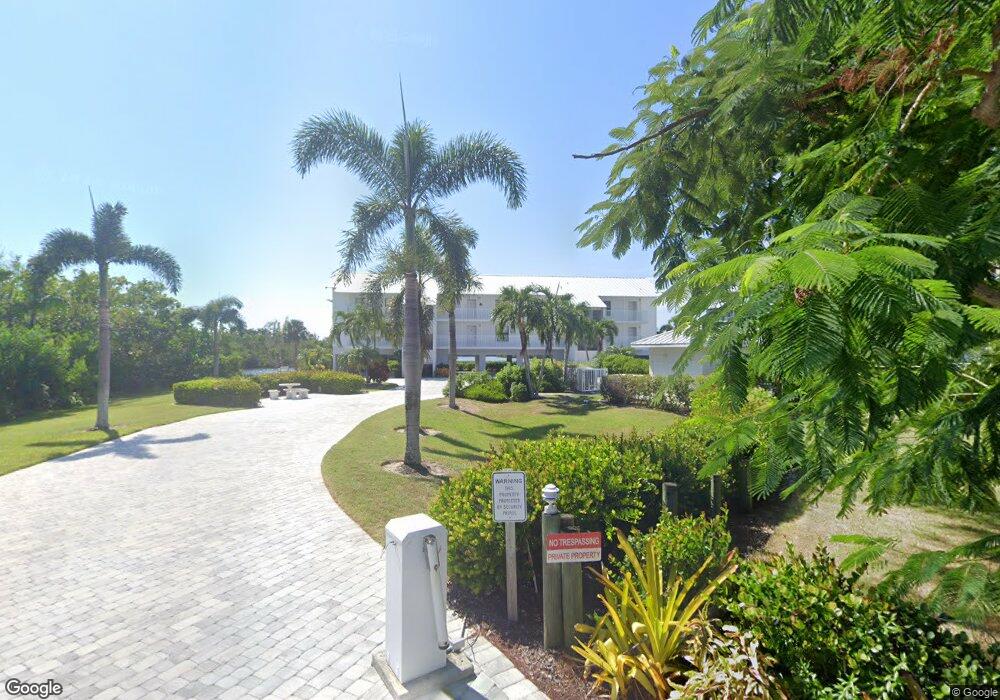
16601 Stringfellow Rd Unit 106 Bokeelia, FL 33922
Estimated Value: $429,641 - $587,000
2
Beds
2
Baths
1,059
Sq Ft
$458/Sq Ft
Est. Value
About This Home
This home is located at 16601 Stringfellow Rd Unit 106, Bokeelia, FL 33922 and is currently estimated at $485,410, approximately $458 per square foot. 16601 Stringfellow Rd Unit 106 is a home located in Lee County with nearby schools including Pine Island Elementary School, Trafalgar Middle School, and Gulf Middle School.
Ownership History
Date
Name
Owned For
Owner Type
Purchase Details
Closed on
May 21, 2021
Sold by
Pulcipher John W and Pulcipher Georgia L
Bought by
John W Pulcipher And Georgia L Purchaser Trus and Pulcipher
Current Estimated Value
Purchase Details
Closed on
Aug 31, 2018
Sold by
Rose Hill Investments Llc
Bought by
Pulcipher John W and Pulcipher Georgia L
Purchase Details
Closed on
Dec 3, 2012
Sold by
Clark Gerald N
Bought by
Rose Hill Investments Llc
Home Financials for this Owner
Home Financials are based on the most recent Mortgage that was taken out on this home.
Original Mortgage
$213,000
Interest Rate
6.76%
Mortgage Type
Seller Take Back
Purchase Details
Closed on
Jun 30, 2004
Sold by
Devane Howard L and Devane Nancy S
Bought by
Clark Gerald N and Clark Everett
Create a Home Valuation Report for This Property
The Home Valuation Report is an in-depth analysis detailing your home's value as well as a comparison with similar homes in the area
Home Values in the Area
Average Home Value in this Area
Purchase History
| Date | Buyer | Sale Price | Title Company |
|---|---|---|---|
| John W Pulcipher And Georgia L Purchaser Trus | $100 | Paulter Kristina | |
| Pulcipher John W | $285,000 | Attorney | |
| Rose Hill Investments Llc | $235,000 | Attorney | |
| Clark Gerald N | $365,000 | Pine Island Title Ins Agency |
Source: Public Records
Mortgage History
| Date | Status | Borrower | Loan Amount |
|---|---|---|---|
| Previous Owner | Rose Hill Investments Llc | $213,000 |
Source: Public Records
Tax History
| Year | Tax Paid | Tax Assessment Tax Assessment Total Assessment is a certain percentage of the fair market value that is determined by local assessors to be the total taxable value of land and additions on the property. | Land | Improvement |
|---|---|---|---|---|
| 2025 | $5,010 | $364,484 | -- | -- |
| 2024 | $5,010 | $331,349 | -- | -- |
| 2023 | $5,016 | $301,226 | $0 | $0 |
| 2022 | $4,275 | $273,842 | $0 | $0 |
| 2021 | $3,862 | $248,947 | $0 | $248,947 |
| 2020 | $3,854 | $245,480 | $0 | $245,480 |
| 2019 | $3,673 | $229,330 | $0 | $229,330 |
| 2018 | $3,737 | $229,330 | $0 | $229,330 |
| 2017 | $3,845 | $230,138 | $0 | $230,138 |
| 2016 | $3,632 | $213,622 | $0 | $213,622 |
| 2015 | $3,272 | $196,400 | $0 | $196,400 |
| 2014 | $3,308 | $197,100 | $0 | $197,100 |
| 2013 | -- | $178,900 | $0 | $178,900 |
Source: Public Records
Map
Nearby Homes
- 16641 Stringfellow Rd Unit 506
- 16641 Stringfellow Rd Unit 502
- 8153 Moyer Ln
- 8161 Moyer Ln
- 16368 Estuary Ct
- 16600 Bocilla Island Club Dr Unit 35
- 16750 Bocilla Palms Dr Unit 70
- 16750 Bocilla Palms Dr Unit 74
- 16709 Bocilla Palms Dr Unit 20
- 16710 Bocilla Island Club Dr
- 7775 Bocilla Ln
- 16303 Shoal Ct
- 16747 Bocilla Palms Dr Unit 15
- 16653 Seagull Bay Ct
- 16750
- 16671 Seagull Bay Ct
- 16361 Stringfellow Rd
- 16295 Boyce Dr
- 7711 Bocilla Ln
- 0 Papaya Ave Unit 225010511
- 16601 Stringfellow Rd Unit 105
- 16601 Stringfellow Rd Unit 101
- 16601 Stringfellow Rd Unit 104
- 16601 Stringfellow Rd Unit 103
- 16601 Stringfellow Rd Unit 102
- 16611 Stringfellow Rd Unit 203
- 16611 Stringfellow Rd Unit 205
- 16611 Stringfellow Rd Unit 201
- 16611 Stringfellow Rd Unit 206
- 16611 Stringfellow Rd Unit 202
- 16611 Stringfellow Rd Unit 204
- 16641 Stringfellow Rd Unit 504
- 16641 Stringfellow Rd Unit 505
- 16641 Stringfellow Rd Unit 503
- 16641 Stringfellow Rd Unit 501
- 16621 Stringfellow Rd Unit 305
- 16621 Stringfellow Rd Unit 301
- 16621 Stringfellow Rd Unit 302
- 16621 Stringfellow Rd Unit 304
- 16621 Stringfellow Rd Unit 306
Your Personal Tour Guide
Ask me questions while you tour the home.