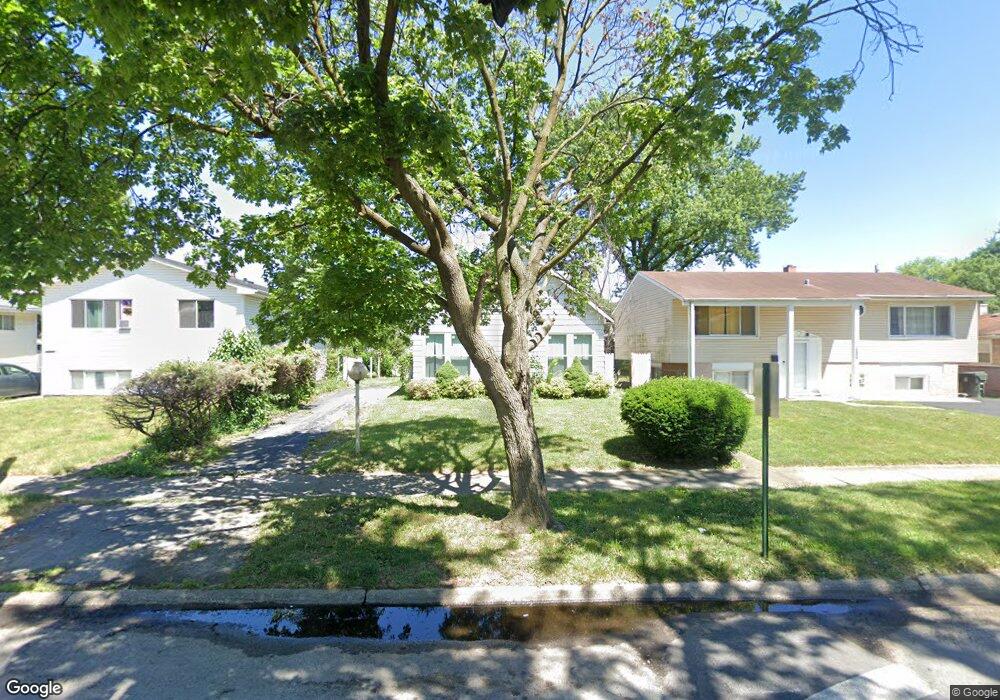
16605 Hermitage Ave Markham, IL 60428
Estimated Value: $148,131 - $169,000
3
Beds
2
Baths
1,065
Sq Ft
$149/Sq Ft
Est. Value
About This Home
This home is located at 16605 Hermitage Ave, Markham, IL 60428 and is currently estimated at $158,533, approximately $148 per square foot. 16605 Hermitage Ave is a home located in Cook County with nearby schools including Thornwood High School.
Ownership History
Date
Name
Owned For
Owner Type
Purchase Details
Closed on
Jun 22, 2017
Sold by
U S Bank Trust Na
Bought by
Coleman Michael
Current Estimated Value
Purchase Details
Closed on
Sep 21, 2016
Sold by
Kerr Lita L and Kerr Lita
Bought by
U S Bank Trust Na and Newland Asset Holding Trust
Purchase Details
Closed on
Aug 18, 1998
Sold by
Residential Funding Corp
Bought by
Kerr Lita L
Home Financials for this Owner
Home Financials are based on the most recent Mortgage that was taken out on this home.
Original Mortgage
$48,300
Interest Rate
11.25%
Purchase Details
Closed on
Nov 28, 1995
Sold by
Demons Annette D
Bought by
Lucas Maydell
Home Financials for this Owner
Home Financials are based on the most recent Mortgage that was taken out on this home.
Original Mortgage
$56,000
Interest Rate
7.52%
Purchase Details
Closed on
May 26, 1995
Sold by
Chemical Bank
Bought by
Demons Annette D
Purchase Details
Closed on
Mar 28, 1995
Sold by
Sheahan Michael F
Bought by
Chemical Bank
Create a Home Valuation Report for This Property
The Home Valuation Report is an in-depth analysis detailing your home's value as well as a comparison with similar homes in the area
Home Values in the Area
Average Home Value in this Area
Purchase History
| Date | Buyer | Sale Price | Title Company |
|---|---|---|---|
| Coleman Michael | $40,500 | Chicago Title Insurance Comp | |
| U S Bank Trust Na | -- | Premier Title | |
| Kerr Lita L | $58,500 | Professional National Title | |
| Lucas Maydell | $70,000 | Law Title Insurance | |
| Demons Annette D | $46,000 | Enterprise Land Title Ltd | |
| Chemical Bank | -- | -- |
Source: Public Records
Mortgage History
| Date | Status | Borrower | Loan Amount |
|---|---|---|---|
| Previous Owner | Kerr Lita L | $48,300 | |
| Previous Owner | Lucas Maydell | $56,000 |
Source: Public Records
Tax History
| Year | Tax Paid | Tax Assessment Tax Assessment Total Assessment is a certain percentage of the fair market value that is determined by local assessors to be the total taxable value of land and additions on the property. | Land | Improvement |
|---|---|---|---|---|
| 2025 | $4,729 | $6,701 | $1,931 | $4,770 |
| 2024 | $4,729 | $6,701 | $1,931 | $4,770 |
| 2023 | $4,859 | $6,701 | $1,931 | $4,770 |
| 2022 | $4,859 | $5,125 | $1,634 | $3,491 |
| 2021 | $4,742 | $5,124 | $1,633 | $3,491 |
| 2020 | $4,563 | $5,124 | $1,633 | $3,491 |
| 2019 | $4,590 | $5,399 | $1,485 | $3,914 |
| 2018 | $4,460 | $5,399 | $1,485 | $3,914 |
| 2017 | $4,350 | $5,399 | $1,485 | $3,914 |
| 2016 | $503 | $5,784 | $1,336 | $4,448 |
| 2015 | $934 | $5,784 | $1,336 | $4,448 |
| 2014 | $4,237 | $5,784 | $1,336 | $4,448 |
| 2013 | $4,685 | $6,825 | $1,336 | $5,489 |
Source: Public Records
Map
Nearby Homes
- 16637 Paulina St
- 16641 Paulina St
- 16547 Paulina St
- 16611 Marshfield Ave
- 16619 Marshfield Ave
- 16527 Marshfield Ave
- 16601 Honore Ave
- 16460 Honore Ave
- 16703 Lincoln St
- 16423 Marshfield Ave
- 16450 Honore Ave
- 16424 Ashland Ave
- 16628 Winchester Ave
- 16707 Dixie Hwy
- 16919 Wood St
- 1716 W 163rd St
- 1924 169th St
- 1848 W 163rd St
- 16229 Marshfield Ave
- 16226 Ashland Ave
- 16601 Hermitage Ave
- 16609 Hermitage Ave
- 16565 Hermitage Ave
- 16613 Hermitage Ave
- 16606 Paulina St
- 16600 Paulina St
- 16559 Hermitage Ave
- 16617 Hermitage Ave
- 16560 Paulina St
- 16614 Paulina St
- 16553 Hermitage Ave
- 16623 Hermitage Ave
- 16556 Paulina St
- 16600 Hermitage Ave
- 16606 Hermitage Ave
- 16562 Hermitage Ave
- 16620 Paulina St
- 16612 Hermitage Ave
- 16552 Paulina St
- 16549 Hermitage Ave