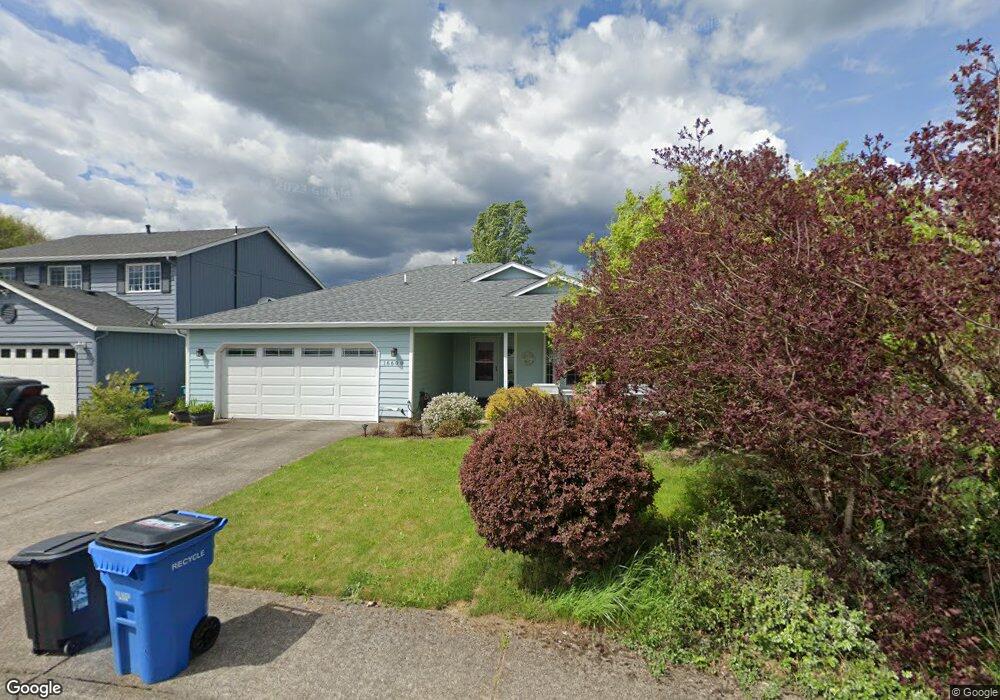
16608 NE 80th St Vancouver, WA 98682
Estimated Value: $488,000 - $536,000
3
Beds
2
Baths
1,513
Sq Ft
$333/Sq Ft
Est. Value
About This Home
This home is located at 16608 NE 80th St, Vancouver, WA 98682 and is currently estimated at $504,391, approximately $333 per square foot. 16608 NE 80th St is a home located in Clark County with nearby schools including Hockinson Middle School and Hockinson High School.
Ownership History
Date
Name
Owned For
Owner Type
Purchase Details
Closed on
Apr 22, 2016
Sold by
Christensen Shelly L and Christensen Tracy L
Bought by
Nordstrom Sandra L
Current Estimated Value
Home Financials for this Owner
Home Financials are based on the most recent Mortgage that was taken out on this home.
Original Mortgage
$229,191
Outstanding Balance
$179,466
Interest Rate
3.25%
Mortgage Type
FHA
Estimated Equity
$324,925
Purchase Details
Closed on
Jul 29, 2003
Sold by
Werner Linda C
Bought by
Christensen Shelly L and Christensen Tracy L
Purchase Details
Closed on
Aug 25, 1999
Sold by
Shadow Ridge Llc
Bought by
Werner Linda C
Home Financials for this Owner
Home Financials are based on the most recent Mortgage that was taken out on this home.
Original Mortgage
$135,830
Interest Rate
7.47%
Mortgage Type
FHA
Create a Home Valuation Report for This Property
The Home Valuation Report is an in-depth analysis detailing your home's value as well as a comparison with similar homes in the area
Home Values in the Area
Average Home Value in this Area
Purchase History
| Date | Buyer | Sale Price | Title Company |
|---|---|---|---|
| Nordstrom Sandra L | $265,000 | Chicago Title Fl Vancouver | |
| Christensen Shelly L | $136,910 | Cascade Title Of Clark | |
| Werner Linda C | $136,739 | Chicago Title Insurance Co |
Source: Public Records
Mortgage History
| Date | Status | Borrower | Loan Amount |
|---|---|---|---|
| Open | Nordstrom Sandra L | $229,191 | |
| Previous Owner | Werner Linda C | $135,830 |
Source: Public Records
Tax History Compared to Growth
Tax History
| Year | Tax Paid | Tax Assessment Tax Assessment Total Assessment is a certain percentage of the fair market value that is determined by local assessors to be the total taxable value of land and additions on the property. | Land | Improvement |
|---|---|---|---|---|
| 2025 | $4,059 | $422,858 | $178,200 | $244,658 |
| 2024 | $3,905 | $427,036 | $178,200 | $248,836 |
| 2023 | $4,079 | $431,735 | $178,200 | $253,535 |
| 2022 | $3,552 | $438,265 | $187,110 | $251,155 |
| 2021 | $3,367 | $356,392 | $151,200 | $205,192 |
| 2020 | $3,272 | $318,002 | $135,000 | $183,002 |
| 2019 | $3,140 | $303,444 | $128,700 | $174,744 |
| 2018 | $3,423 | $296,421 | $0 | $0 |
| 2017 | $3,093 | $251,200 | $0 | $0 |
| 2016 | $2,976 | $240,473 | $0 | $0 |
| 2015 | $2,872 | $212,811 | $0 | $0 |
| 2014 | -- | $204,901 | $0 | $0 |
| 2013 | -- | $168,223 | $0 | $0 |
Source: Public Records
Map
Nearby Homes
- 16604 NE 80th St
- 8101 NE 167th Ave
- 7811 NE 167th Ave
- 17101 NE 82nd St
- 16808 NE 80th St
- 16705 NE 83rd St
- 8211 NE 168th Place
- 8200 NE 170th Ave
- 8208 NE 170th Ave
- 17013 NE 81st St
- 8116 NE 163rd Ave
- 17011 NE 82nd St
- 17015 NE 82nd St
- 17014 NE 82nd St
- 8409 NE 168th Ave
- 17109 NE 82nd St
- 17114 NE 81st St
- 8103 NE 172nd Ave
- Chelan Plan at Si Ellen Farms
- Cashmere Plan at Si Ellen Farms
- 16527 NE 81st St
- 16600 NE 80th St
- 16706 NE 80th St
- 16525 NE 81st St
- 8003 NE 167th Ave
- 16609 NE 80th St
- 16520 NE 80th St
- 16605 NE 80th St
- 16523 NE 81st St
- 8007 NE 167th Ave
- 16710 NE 80th St
- 7913 NE 167th Ave
- 16601 NE 80th St
- 8103 NE 166th Ave
- 16521 NE 81st St
- 16516 NE 80th St
- 8006 NE 168th Ave
- 16521 NE 80th St
- 16714 NE 80th St
- 8107 NE 166th Ave