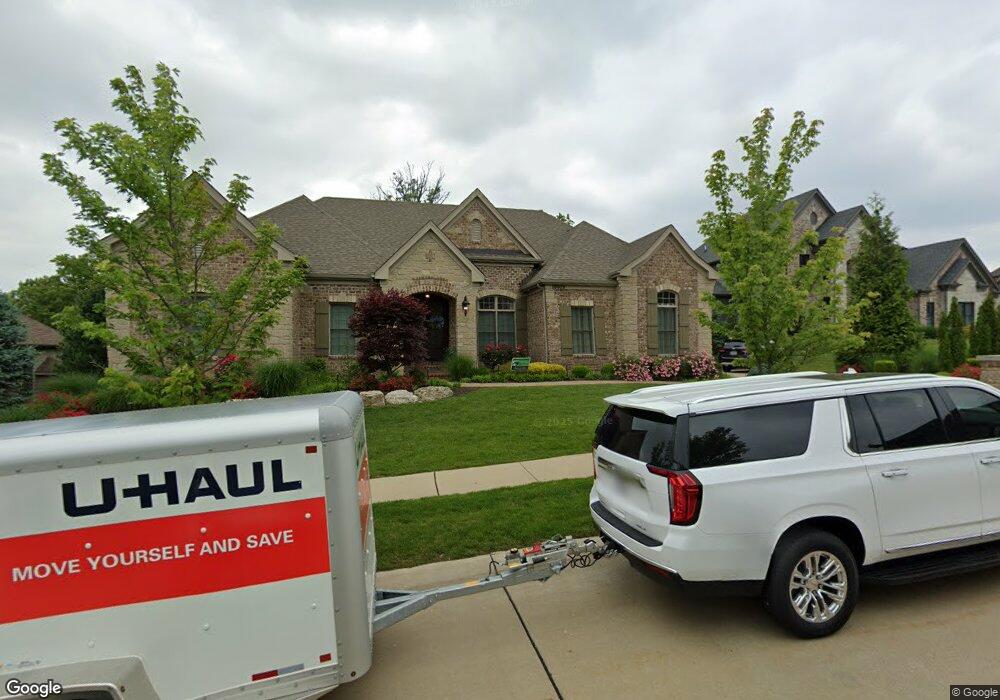
16609 Kolbie Manors Ct Wildwood, MO 63040
Estimated Value: $978,000 - $1,211,000
3
Beds
4
Baths
5,347
Sq Ft
$210/Sq Ft
Est. Value
About This Home
This home is located at 16609 Kolbie Manors Ct, Wildwood, MO 63040 and is currently estimated at $1,121,966, approximately $209 per square foot. 16609 Kolbie Manors Ct is a home located in St. Louis County with nearby schools including Fairway Elementary School, Wildwood Middle School, and Eureka Senior High School.
Ownership History
Date
Name
Owned For
Owner Type
Purchase Details
Closed on
Nov 8, 2019
Sold by
Burns Clark and Burns Judy
Bought by
Merrick Matthew and Merrick Tamara
Current Estimated Value
Home Financials for this Owner
Home Financials are based on the most recent Mortgage that was taken out on this home.
Original Mortgage
$628,000
Outstanding Balance
$551,837
Interest Rate
3.65%
Mortgage Type
New Conventional
Estimated Equity
$570,129
Purchase Details
Closed on
Sep 30, 2014
Sold by
Claymond Development Llc
Bought by
Burns Clark and Burns Judy
Home Financials for this Owner
Home Financials are based on the most recent Mortgage that was taken out on this home.
Original Mortgage
$740,000
Interest Rate
3%
Mortgage Type
Adjustable Rate Mortgage/ARM
Create a Home Valuation Report for This Property
The Home Valuation Report is an in-depth analysis detailing your home's value as well as a comparison with similar homes in the area
Home Values in the Area
Average Home Value in this Area
Purchase History
| Date | Buyer | Sale Price | Title Company |
|---|---|---|---|
| Merrick Matthew | $785,000 | Investors Title Co Clayton | |
| Burns Clark | $946,435 | Title Partners Agency Llc |
Source: Public Records
Mortgage History
| Date | Status | Borrower | Loan Amount |
|---|---|---|---|
| Open | Merrick Matthew | $628,000 | |
| Previous Owner | Burns Clark | $740,000 |
Source: Public Records
Tax History Compared to Growth
Tax History
| Year | Tax Paid | Tax Assessment Tax Assessment Total Assessment is a certain percentage of the fair market value that is determined by local assessors to be the total taxable value of land and additions on the property. | Land | Improvement |
|---|---|---|---|---|
| 2025 | $12,159 | $177,380 | $41,950 | $135,430 |
| 2024 | $12,159 | $174,860 | $25,180 | $149,680 |
| 2023 | $12,159 | $174,860 | $25,180 | $149,680 |
| 2022 | $11,962 | $159,910 | $49,120 | $110,790 |
| 2021 | $11,874 | $159,910 | $49,120 | $110,790 |
| 2020 | $12,669 | $162,680 | $39,330 | $123,350 |
| 2019 | $12,720 | $162,680 | $39,330 | $123,350 |
| 2018 | $12,669 | $152,780 | $22,330 | $130,450 |
| 2017 | $12,366 | $152,780 | $22,330 | $130,450 |
| 2016 | $14,378 | $170,830 | $22,330 | $148,500 |
| 2015 | $14,085 | $170,830 | $22,330 | $148,500 |
| 2014 | $358 | $4,240 | $4,240 | $0 |
Source: Public Records
Map
Nearby Homes
- 116 Sweet Cherry Way
- 112 Boathouse Dr
- 2551 Forest Leaf Pkwy
- 16410 Centerpointe Dr
- 2452 Autumn Pines Dr
- 16509 Carriage View Ct
- 16518 Victoria Crossing Dr Unit B
- 16530 Victoria Crossing Dr Unit I
- 16175 Port of Nantucket Dr
- 123 Carriage View Dr
- 134 Jubilee Hill Dr Unit H
- 134 Jubilee Hill Dr Unit K
- 103 Jubilee Hill Dr Unit L
- 16566 Victoria Crossing Dr Unit C
- 411 Oriole Hill Ct
- 16037 Surfview Ct
- 2308 Sand Cherry Dr
- 2424 Eatherton Rd
- 16042 Nantucket Island Dr
- 16621 Green Pines Dr
- 16609 Kolbie Manors Ct
- 16609 Kolbie Manors Ct
- 16613 Kolbie Manors Ct
- 16605 Kolbie Manors Ct
- 16605 Kolbie Manors Ct
- 16604 Kolbie Manors Ct
- 16604 Kolbie Manors Ct
- 16600 Kolbie Manors Ct
- 16608 Kolbie Manors Ct
- 0 Unknown Unit 17073416
- 0 Unknown Unit 17073414
- 0 Unknown Unit 17073410
- 0 Unknown Unit 17073409
- 0 Tbb Enclaves at Cherry Hills Ct Unit 14063396
- 0 Tbb Enclaves at Cherry Hills Ct Unit 14063397
- 0 Tbb Enclaves at Cherry Hills Ct Unit 14063394
- 0 Unknown Unit 780585
- 0 Unknown Unit Conce 661250
- 0 Unknown Unit Raphl 661249
- 0 Unknown Unit Dushn 661248