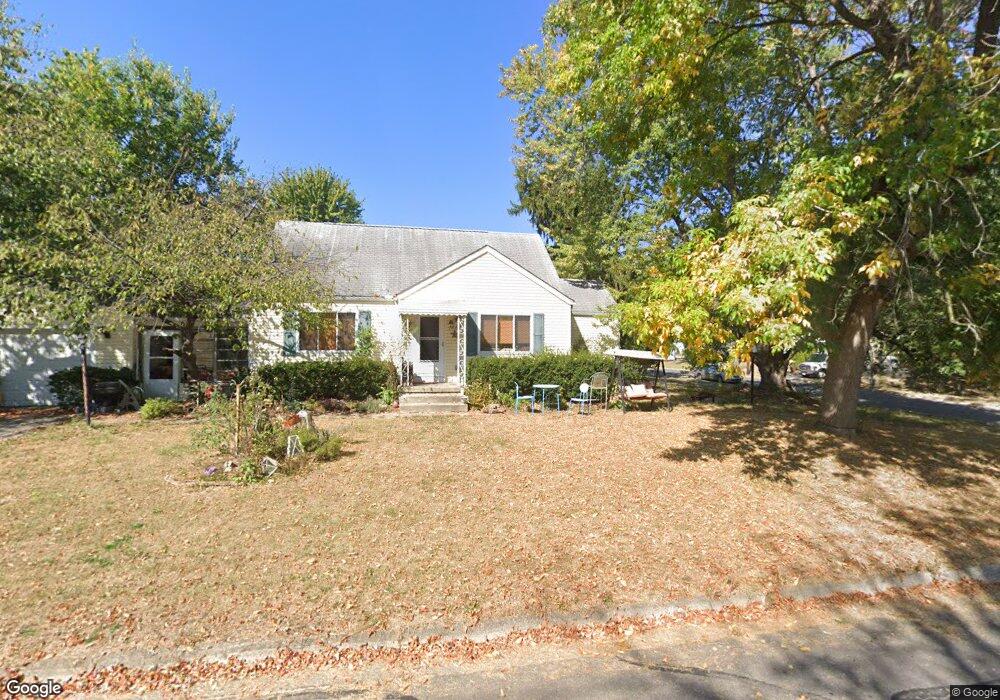
1661 Pauline Ave Columbus, OH 43224
North Linden NeighborhoodEstimated Value: $170,000 - $197,000
3
Beds
1
Bath
1,212
Sq Ft
$156/Sq Ft
Est. Value
About This Home
This home is located at 1661 Pauline Ave, Columbus, OH 43224 and is currently estimated at $188,939, approximately $155 per square foot. 1661 Pauline Ave is a home located in Franklin County with nearby schools including Huy Elementary School, Medina Middle School, and Mifflin High School.
Ownership History
Date
Name
Owned For
Owner Type
Purchase Details
Closed on
Sep 21, 2017
Sold by
Rogers Malissa A and The Malissa A Rogers Living Tr
Bought by
Rogers Malissa A and The Malissa A Rogers Living Tr
Current Estimated Value
Purchase Details
Closed on
Mar 30, 2015
Sold by
Rogers Malissa A and Rogers Ploy
Bought by
Rogers Malissa A and The Melissa A Rogers Living Tr
Purchase Details
Closed on
Dec 3, 1996
Sold by
Elliott Richard A
Bought by
Rogers Ploy and Rogers Melissa A
Home Financials for this Owner
Home Financials are based on the most recent Mortgage that was taken out on this home.
Original Mortgage
$59,850
Interest Rate
7.94%
Mortgage Type
New Conventional
Purchase Details
Closed on
Aug 2, 1994
Sold by
Dorsey Charles J
Bought by
Richard A Elliott
Home Financials for this Owner
Home Financials are based on the most recent Mortgage that was taken out on this home.
Original Mortgage
$58,000
Interest Rate
6.5%
Mortgage Type
New Conventional
Purchase Details
Closed on
Jun 1, 1986
Create a Home Valuation Report for This Property
The Home Valuation Report is an in-depth analysis detailing your home's value as well as a comparison with similar homes in the area
Home Values in the Area
Average Home Value in this Area
Purchase History
| Date | Buyer | Sale Price | Title Company |
|---|---|---|---|
| Rogers Malissa A | -- | None Available | |
| Rogers Malissa A | -- | None Available | |
| Rogers Ploy | $63,000 | -- | |
| Richard A Elliott | $58,000 | -- | |
| -- | -- | -- |
Source: Public Records
Mortgage History
| Date | Status | Borrower | Loan Amount |
|---|---|---|---|
| Previous Owner | Rogers Ploy | $59,850 | |
| Previous Owner | Richard A Elliott | $58,000 |
Source: Public Records
Tax History
| Year | Tax Paid | Tax Assessment Tax Assessment Total Assessment is a certain percentage of the fair market value that is determined by local assessors to be the total taxable value of land and additions on the property. | Land | Improvement |
|---|---|---|---|---|
| 2025 | $2,749 | $61,260 | $13,130 | $48,130 |
| 2024 | $2,749 | $61,260 | $13,130 | $48,130 |
| 2023 | $2,714 | $61,250 | $13,125 | $48,125 |
| 2022 | $1,857 | $35,810 | $7,530 | $28,280 |
| 2021 | $1,861 | $35,810 | $7,530 | $28,280 |
| 2020 | $1,863 | $35,810 | $7,530 | $28,280 |
| 2019 | $1,671 | $27,550 | $6,020 | $21,530 |
| 2018 | $1,651 | $27,550 | $6,020 | $21,530 |
| 2017 | $1,670 | $27,550 | $6,020 | $21,530 |
| 2016 | $1,800 | $27,170 | $6,060 | $21,110 |
| 2015 | $1,634 | $27,170 | $6,060 | $21,110 |
| 2014 | $1,638 | $27,170 | $6,060 | $21,110 |
| 2013 | $590 | $28,595 | $6,370 | $22,225 |
Source: Public Records
Map
Nearby Homes
- 3498 Bremen St
- 3423 Bremen St
- 3414 Norwood St
- 3543 Norwood St
- 3384 Dresden St
- 3508 Kenlawn St
- 3464 Ontario St
- 3585 Ontario St
- 3629 Ontario St
- 3620 Walmar Dr
- 1711 Piedmont Rd
- 1812 Audrey Rd
- 3538 Karl Rd
- 3401 Walmar Dr
- 3606 Karl Rd
- 3750 Dresden St
- 1352 Northridge Rd
- 1887 E Cooke Rd Unit A
- 3134 Medina Ave
- 3767 Karl Rd Unit 322
- 1653 Pauline Ave
- 3459 Bremen St
- 1675 Pauline Ave
- 3482 Dresden St
- 3476 Dresden St
- 3453 Bremen St
- 3493 Bremen St
- 3468 Dresden St
- 3458 Bremen St
- 1681 Pauline Ave
- 3447 Bremen St
- 3496 Dresden St
- 3452 Bremen St
- 3492 Bremen St
- 3497 Bremen St
- 3456 Dresden St
- 3446 Bremen St
- 3504 Dresden St
- 3441 Bremen St
- 3469 Oaklawn St
Your Personal Tour Guide
Ask me questions while you tour the home.