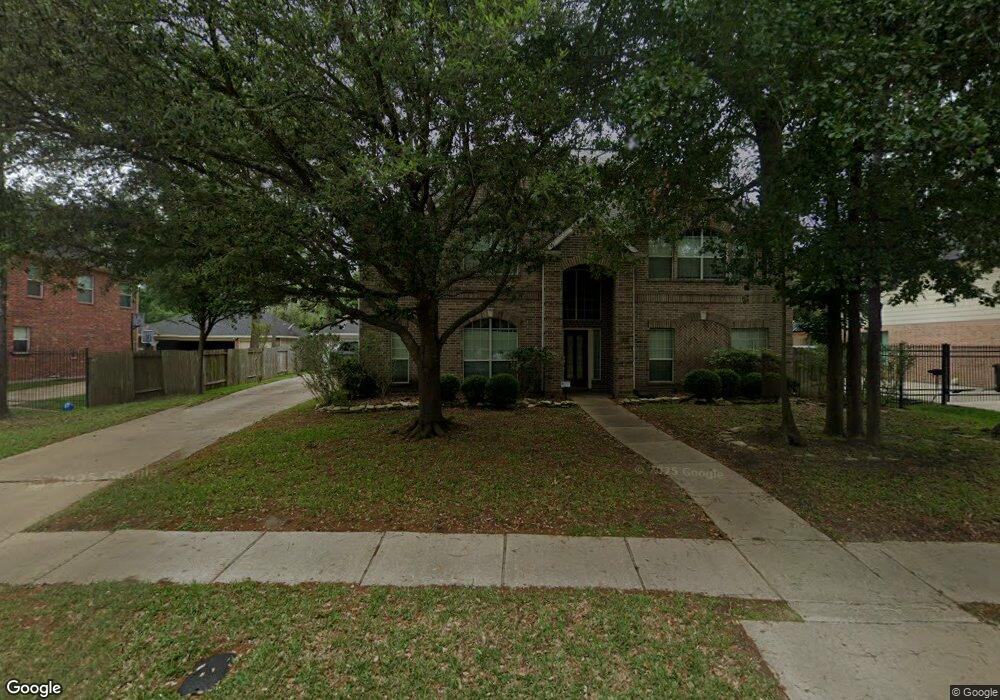
16610 Darby House St Cypress, TX 77429
Estimated Value: $520,024 - $572,000
4
Beds
4
Baths
3,385
Sq Ft
$161/Sq Ft
Est. Value
About This Home
This home is located at 16610 Darby House St, Cypress, TX 77429 and is currently estimated at $544,256, approximately $160 per square foot. 16610 Darby House St is a home located in Harris County with nearby schools including Sampson Elementary School, Spillane Middle School, and Cypress Woods High School.
Ownership History
Date
Name
Owned For
Owner Type
Purchase Details
Closed on
Mar 21, 2007
Sold by
Mooney Larry and Mooney Clementina
Bought by
Anderson Albert R and Anderson Delbis G
Current Estimated Value
Home Financials for this Owner
Home Financials are based on the most recent Mortgage that was taken out on this home.
Original Mortgage
$204,600
Interest Rate
6.26%
Mortgage Type
Purchase Money Mortgage
Purchase Details
Closed on
Aug 27, 2003
Sold by
Shepherd John L and Shepherd Laura
Bought by
Mooney Larry and Mooney Clementina
Home Financials for this Owner
Home Financials are based on the most recent Mortgage that was taken out on this home.
Original Mortgage
$247,000
Interest Rate
5.71%
Mortgage Type
Purchase Money Mortgage
Purchase Details
Closed on
Jan 31, 2001
Sold by
Newmark Homes Lp
Bought by
Shepherd John L and Shepherd Laura
Home Financials for this Owner
Home Financials are based on the most recent Mortgage that was taken out on this home.
Original Mortgage
$203,950
Interest Rate
10.5%
Create a Home Valuation Report for This Property
The Home Valuation Report is an in-depth analysis detailing your home's value as well as a comparison with similar homes in the area
Home Values in the Area
Average Home Value in this Area
Purchase History
| Date | Buyer | Sale Price | Title Company |
|---|---|---|---|
| Anderson Albert R | -- | Guardian Fidelity Title | |
| Mooney Larry | -- | -- | |
| Shepherd John L | -- | Pacific Title Lc |
Source: Public Records
Mortgage History
| Date | Status | Borrower | Loan Amount |
|---|---|---|---|
| Closed | Anderson Albert R | $204,600 | |
| Previous Owner | Mooney Larry | $247,000 | |
| Previous Owner | Shepherd John L | $203,950 | |
| Closed | Shepherd John L | $50,000 |
Source: Public Records
Tax History Compared to Growth
Tax History
| Year | Tax Paid | Tax Assessment Tax Assessment Total Assessment is a certain percentage of the fair market value that is determined by local assessors to be the total taxable value of land and additions on the property. | Land | Improvement |
|---|---|---|---|---|
| 2025 | $6,836 | $451,000 | $105,329 | $345,671 |
| 2024 | $6,836 | $489,936 | $95,795 | $394,141 |
| 2023 | $6,836 | $489,936 | $95,795 | $394,141 |
| 2022 | $8,520 | $440,244 | $68,555 | $371,689 |
| 2021 | $8,207 | $323,000 | $68,555 | $254,445 |
| 2020 | $8,458 | $322,301 | $55,833 | $266,468 |
| 2019 | $8,968 | $331,456 | $55,833 | $275,623 |
| 2018 | $3,179 | $307,220 | $55,833 | $251,387 |
| 2017 | $8,345 | $307,220 | $55,833 | $251,387 |
| 2016 | $9,148 | $336,770 | $55,833 | $280,937 |
| 2015 | $7,080 | $336,770 | $55,833 | $280,937 |
| 2014 | $7,080 | $336,770 | $55,833 | $280,937 |
Source: Public Records
Map
Nearby Homes
- 16606 Darby House St
- 13506 Key Ridge Ln
- 16515 Dunleith Cir
- 16406 Haden Crest Ct
- 16322 Bontura St
- 13402 Layton Castle Ln
- 16306 Bontura St
- 13703 Layton Hills Dr
- 13611 Monteigne Ln
- 16502 Rawhide Trail
- 16219 Haden Crest Ct
- 16535 Tejas Trail
- 14015 Falcon Heights Dr
- 16514 Boston Post Rd
- 16211 Halpren Falls Ln
- 16518 Boston Post Rd
- 14015 Halprin Creek Dr
- 16530 Boston Post Rd
- 16342 Granite Park Ct
- 15902 Mill Canyon Ct
- 16614 Darby House St
- 16618 Darby House St
- 16611 Darby House St
- 16615 Darby House St
- 16619 Darby House St
- 16622 Darby House St
- 16603 Darby House St
- 13511 Darby House Ct
- 16623 Darby House St
- 13519 Oak Alley Ln
- 16626 Darby House St
- 16527 Darby House St
- 13515 Oak Alley Ln
- 16526 Westwego Trail
- 16627 Darby House St
- 13510 Darby House Ct
- 13511 Oak Alley Ln
- 13502 Key Ridge Ln
- 16526 Darby House St
- 16630 Darby House St