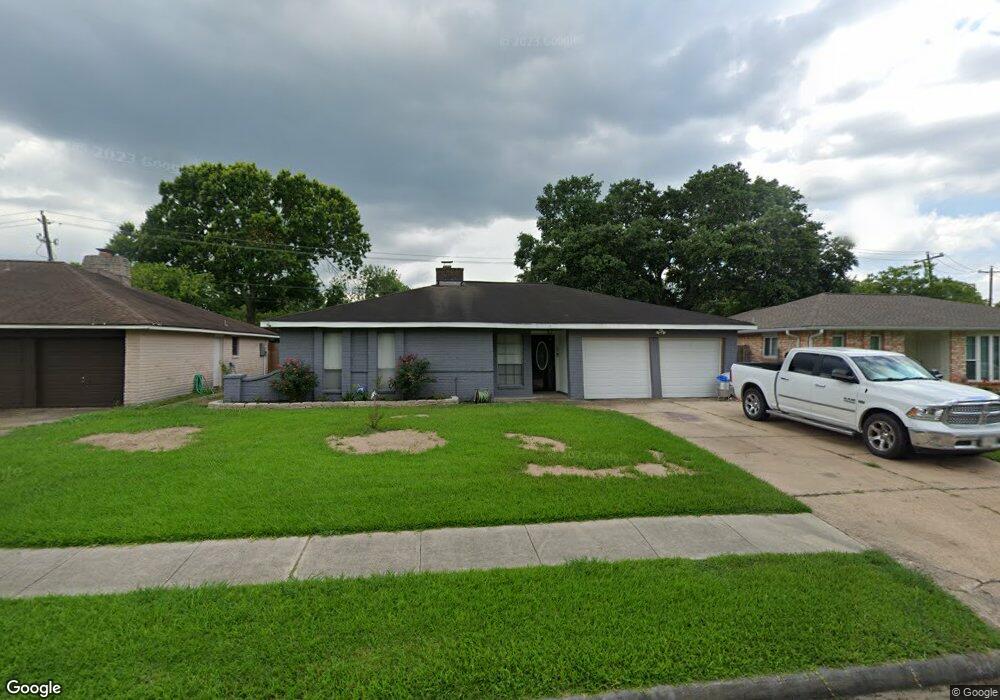
16610 David Glen Dr Friendswood, TX 77546
Estimated Value: $216,259 - $235,000
2
Beds
2
Baths
1,220
Sq Ft
$186/Sq Ft
Est. Value
About This Home
This home is located at 16610 David Glen Dr, Friendswood, TX 77546 and is currently estimated at $227,065, approximately $186 per square foot. 16610 David Glen Dr is a home located in Harris County with nearby schools including Wedgewood Elementary School, Brookside Intermediate School, and Clear Brook High School.
Ownership History
Date
Name
Owned For
Owner Type
Purchase Details
Closed on
Feb 18, 2008
Sold by
Allison John M and Allison Tammy S
Bought by
Cadenas Lydia U
Current Estimated Value
Home Financials for this Owner
Home Financials are based on the most recent Mortgage that was taken out on this home.
Original Mortgage
$85,850
Outstanding Balance
$53,640
Interest Rate
5.88%
Mortgage Type
Purchase Money Mortgage
Estimated Equity
$173,425
Purchase Details
Closed on
Sep 2, 2003
Sold by
Bicknell Stephen George and Bicknell Marta Lynn
Bought by
Allison John M and Allison Tammy S
Home Financials for this Owner
Home Financials are based on the most recent Mortgage that was taken out on this home.
Original Mortgage
$64,800
Interest Rate
6.08%
Mortgage Type
Purchase Money Mortgage
Create a Home Valuation Report for This Property
The Home Valuation Report is an in-depth analysis detailing your home's value as well as a comparison with similar homes in the area
Home Values in the Area
Average Home Value in this Area
Purchase History
| Date | Buyer | Sale Price | Title Company |
|---|---|---|---|
| Cadenas Lydia U | -- | American Title Company | |
| Allison John M | -- | Alamo Title Company |
Source: Public Records
Mortgage History
| Date | Status | Borrower | Loan Amount |
|---|---|---|---|
| Open | Cadenas Lydia U | $85,850 | |
| Previous Owner | Allison John M | $64,800 |
Source: Public Records
Tax History Compared to Growth
Tax History
| Year | Tax Paid | Tax Assessment Tax Assessment Total Assessment is a certain percentage of the fair market value that is determined by local assessors to be the total taxable value of land and additions on the property. | Land | Improvement |
|---|---|---|---|---|
| 2025 | $2,759 | $223,602 | $57,998 | $165,604 |
| 2024 | $2,759 | $204,947 | $57,998 | $146,949 |
| 2023 | $2,759 | $209,358 | $57,998 | $151,360 |
| 2022 | $3,844 | $192,018 | $57,998 | $134,020 |
| 2021 | $3,684 | $165,218 | $48,840 | $116,378 |
| 2020 | $3,639 | $148,635 | $35,104 | $113,531 |
| 2019 | $3,528 | $137,416 | $27,473 | $109,943 |
| 2018 | $642 | $126,400 | $27,473 | $98,927 |
| 2017 | $3,263 | $126,400 | $27,473 | $98,927 |
| 2016 | $3,061 | $124,452 | $27,473 | $96,979 |
| 2015 | $2,055 | $114,264 | $27,473 | $86,791 |
| 2014 | $2,055 | $98,316 | $22,894 | $75,422 |
Source: Public Records
Map
Nearby Homes
- 16607 David Glen Dr
- 16703 Hibiscus Ln
- 4311 Townes Forest Rd
- 16510 Blackhawk Blvd
- 16903 Paint Rock Rd
- 16406 Blackhawk Blvd
- 16907 Tibet Rd
- 16303 Townes Rd
- 5323 Abercreek Ave
- 5498 Apple Blossom Ln
- 16327 Blackhawk Blvd
- 4015 Ravine Dr
- 17003 Tibet Rd
- 16811 Bougainvilla Ln
- 16926 Blackhawk Blvd
- 16222 Forest Bend Ave
- 16823 Bougainvilla Ln
- 5343 Royal Pkwy
- 4426 Saffron Ln
- 4430 Peridot Ln
- 16606 David Glen Dr
- 16614 David Glen Dr
- 16615 Townes Rd
- 16618 David Glen Dr
- 16602 David Glen Dr
- 16619 Townes Rd
- 16623 Townes Rd
- 16611 David Glen Dr
- 16615 David Glen Dr
- 16622 David Glen Dr
- 16603 David Glen Dr
- 16619 David Glen Dr
- 16627 Townes Rd
- 16626 David Glen Dr
- 16623 David Glen Dr
- .46 AC Townes Rd
- 16631 Townes Rd
- 3902 Townes Forest Rd
- 3906 Townes Forest Rd
- 16618 Forest Bend Ave