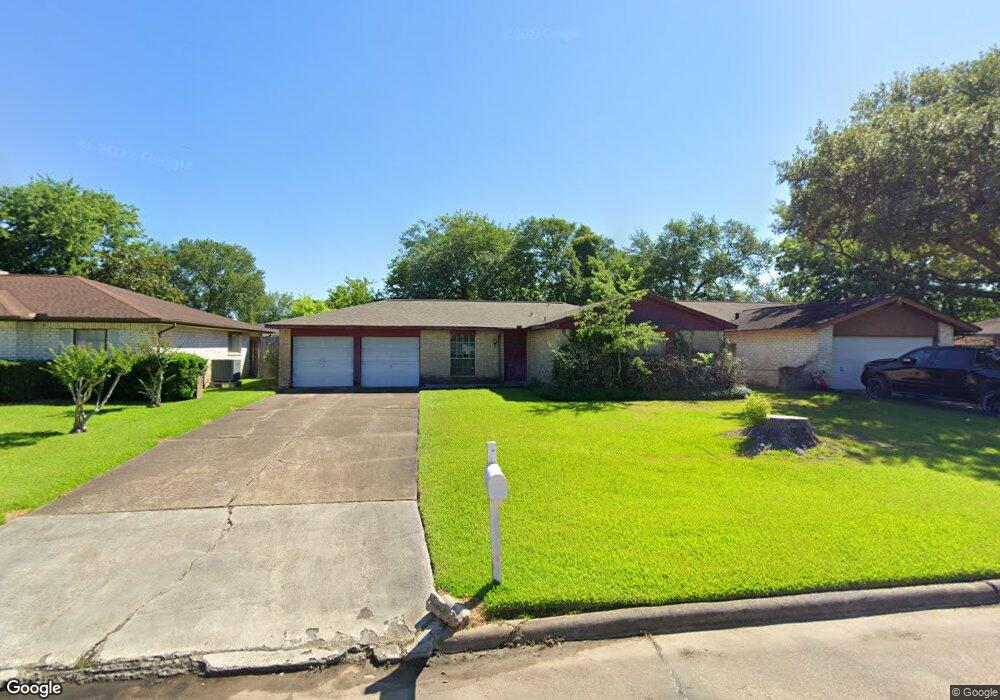
16619 Tibet Rd Friendswood, TX 77546
Estimated Value: $227,285 - $244,000
4
Beds
2
Baths
1,157
Sq Ft
$201/Sq Ft
Est. Value
About This Home
This home is located at 16619 Tibet Rd, Friendswood, TX 77546 and is currently estimated at $233,071, approximately $201 per square foot. 16619 Tibet Rd is a home located in Harris County with nearby schools including Wedgewood Elementary School, Brookside Intermediate School, and Clear Brook High School.
Ownership History
Date
Name
Owned For
Owner Type
Purchase Details
Closed on
Nov 14, 2024
Sold by
Campbell Donald W
Bought by
Gondal Atif Javeed
Current Estimated Value
Purchase Details
Closed on
Jul 17, 1998
Sold by
Lynskey Edward W and Lynskey Lois J M
Bought by
Campbell Donald W and Campbell Melodie L
Home Financials for this Owner
Home Financials are based on the most recent Mortgage that was taken out on this home.
Original Mortgage
$61,350
Interest Rate
7.09%
Mortgage Type
FHA
Purchase Details
Closed on
Sep 8, 1995
Sold by
Albright Robert A and Albright Robyn E
Bought by
Lynskey Edward W and Lynskey Lois J M
Home Financials for this Owner
Home Financials are based on the most recent Mortgage that was taken out on this home.
Original Mortgage
$65,280
Interest Rate
7.78%
Mortgage Type
Assumption
Create a Home Valuation Report for This Property
The Home Valuation Report is an in-depth analysis detailing your home's value as well as a comparison with similar homes in the area
Home Values in the Area
Average Home Value in this Area
Purchase History
| Date | Buyer | Sale Price | Title Company |
|---|---|---|---|
| Gondal Atif Javeed | -- | None Listed On Document | |
| Gondal Atif Javeed | -- | None Listed On Document | |
| Campbell Donald W | -- | -- | |
| Lynskey Edward W | -- | Texas American Title Company |
Source: Public Records
Mortgage History
| Date | Status | Borrower | Loan Amount |
|---|---|---|---|
| Previous Owner | Campbell Donald W | $61,350 | |
| Previous Owner | Lynskey Edward W | $65,280 |
Source: Public Records
Tax History Compared to Growth
Tax History
| Year | Tax Paid | Tax Assessment Tax Assessment Total Assessment is a certain percentage of the fair market value that is determined by local assessors to be the total taxable value of land and additions on the property. | Land | Improvement |
|---|---|---|---|---|
| 2025 | $271 | $220,924 | $58,520 | $162,404 |
| 2024 | $271 | $202,797 | $58,520 | $144,277 |
| 2023 | $271 | $207,111 | $58,520 | $148,591 |
| 2022 | $3,771 | $189,693 | $58,520 | $131,173 |
| 2021 | $3,614 | $162,618 | $49,280 | $113,338 |
| 2020 | $3,569 | $145,802 | $35,421 | $110,381 |
| 2019 | $3,456 | $134,608 | $27,720 | $106,888 |
| 2018 | $0 | $123,754 | $27,720 | $96,034 |
| 2017 | $3,194 | $123,754 | $27,720 | $96,034 |
| 2016 | $2,998 | $121,862 | $27,720 | $94,142 |
| 2015 | $814 | $111,970 | $27,720 | $84,250 |
| 2014 | $814 | $96,195 | $23,101 | $73,094 |
Source: Public Records
Map
Nearby Homes
- 16607 David Glen Dr
- 16510 Blackhawk Blvd
- 16703 Hibiscus Ln
- 16406 Blackhawk Blvd
- 16907 Tibet Rd
- 16811 Bougainvilla Ln
- 16922 Echo Harbor
- 16327 Blackhawk Blvd
- 16823 Bougainvilla Ln
- 16903 Paint Rock Rd
- 16423 Hibiscus Ln
- 17003 Tibet Rd
- 16303 Townes Rd
- 4015 Ravine Dr
- 17015 Townes Rd
- 5323 Abercreek Ave
- 16222 Forest Bend Ave
- 5343 Royal Pkwy
- 5498 Apple Blossom Ln
- 4315 Ravine Dr
- 16615 Tibet Rd
- 16623 Tibet Rd
- 16618 Barcelona Dr
- 16611 Tibet Rd
- 16627 Tibet Rd
- 16622 Barcelona Dr
- 16614 Barcelona Dr
- 16626 Barcelona Dr
- 16610 Barcelona Dr
- 16618 Tibet Rd
- 16614 Tibet Rd
- 16622 Tibet Rd
- 16607 Tibet Rd
- 16631 Tibet Rd
- 16626 Tibet Rd
- 16610 Tibet Rd
- 16630 Barcelona Dr
- 16606 Barcelona Dr
- 16635 Tibet Rd
- 16630 Tibet Rd