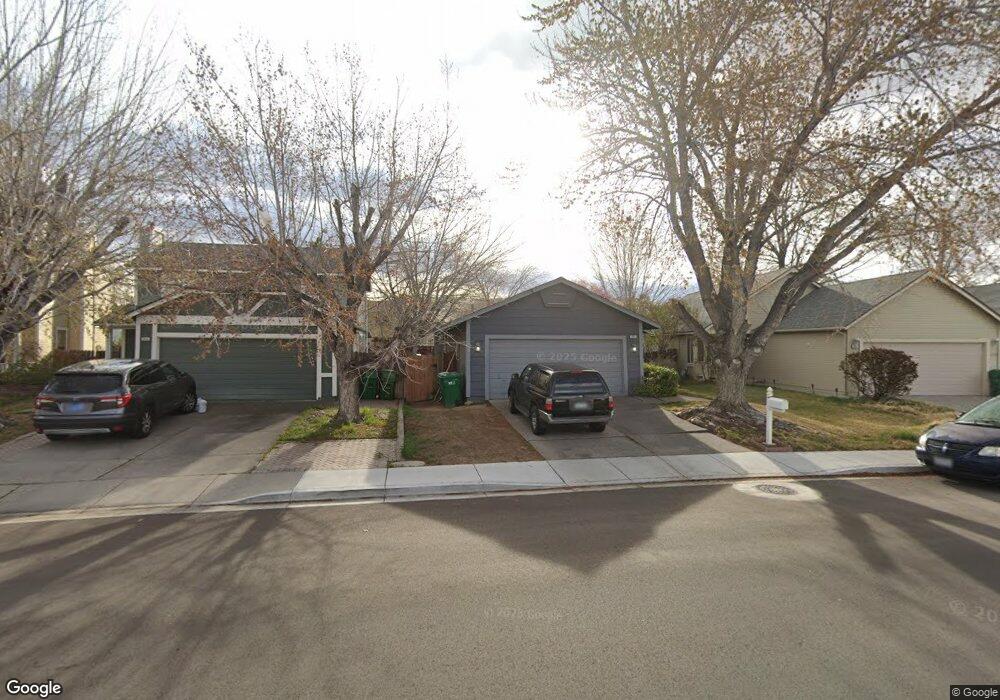
1662 Union St Sparks, NV 89434
O'Callaghan NeighborhoodEstimated Value: $405,000 - $439,000
2
Beds
2
Baths
1,164
Sq Ft
$362/Sq Ft
Est. Value
About This Home
This home is located at 1662 Union St, Sparks, NV 89434 and is currently estimated at $421,855, approximately $362 per square foot. 1662 Union St is a home located in Washoe County with nearby schools including Katherine Dunn Elementary School, George L Dilworth Middle School, and Edward C Reed High School.
Ownership History
Date
Name
Owned For
Owner Type
Purchase Details
Closed on
Aug 31, 2004
Sold by
Corbett Carol J and Corbett Richard D
Bought by
Corbett Richard D and Corbett Carol J
Current Estimated Value
Home Financials for this Owner
Home Financials are based on the most recent Mortgage that was taken out on this home.
Original Mortgage
$174,250
Outstanding Balance
$93,368
Interest Rate
7.12%
Mortgage Type
New Conventional
Estimated Equity
$328,487
Purchase Details
Closed on
Feb 24, 1998
Sold by
Miranda Bertha
Bought by
Corbett Richard D and Corbett Carol J
Home Financials for this Owner
Home Financials are based on the most recent Mortgage that was taken out on this home.
Original Mortgage
$107,550
Interest Rate
6.9%
Purchase Details
Closed on
Aug 8, 1997
Sold by
Arreygue Macario
Bought by
Miranda Bertha
Purchase Details
Closed on
Nov 28, 1994
Sold by
Miranda Federico
Bought by
Miranda Bertha
Create a Home Valuation Report for This Property
The Home Valuation Report is an in-depth analysis detailing your home's value as well as a comparison with similar homes in the area
Home Values in the Area
Average Home Value in this Area
Purchase History
| Date | Buyer | Sale Price | Title Company |
|---|---|---|---|
| Corbett Richard D | -- | Stewart Title Of Northern Nv | |
| Corbett Richard D | $119,500 | First Centennial Title Co | |
| Miranda Bertha | -- | First American Title Co | |
| Miranda Bertha | -- | First Commercial Title Inc | |
| Arreygue Macario | $116,000 | First Commercial Title Inc |
Source: Public Records
Mortgage History
| Date | Status | Borrower | Loan Amount |
|---|---|---|---|
| Open | Corbett Richard D | $174,250 | |
| Closed | Corbett Richard D | $107,550 |
Source: Public Records
Tax History Compared to Growth
Tax History
| Year | Tax Paid | Tax Assessment Tax Assessment Total Assessment is a certain percentage of the fair market value that is determined by local assessors to be the total taxable value of land and additions on the property. | Land | Improvement |
|---|---|---|---|---|
| 2025 | $1,446 | $64,047 | $34,580 | $29,467 |
| 2024 | $1,405 | $62,902 | $32,725 | $30,177 |
| 2023 | $1,405 | $61,282 | $32,305 | $28,977 |
| 2022 | $1,365 | $50,451 | $26,005 | $24,446 |
| 2021 | $1,325 | $44,465 | $19,845 | $24,620 |
| 2020 | $1,285 | $44,802 | $19,775 | $25,027 |
| 2019 | $1,248 | $43,445 | $18,935 | $24,510 |
| 2018 | $1,212 | $38,138 | $13,965 | $24,173 |
| 2017 | $1,177 | $37,127 | $12,670 | $24,457 |
| 2016 | $1,147 | $36,620 | $11,410 | $25,210 |
| 2015 | $1,144 | $35,226 | $9,625 | $25,601 |
| 2014 | $1,088 | $32,507 | $8,225 | $24,282 |
| 2013 | -- | $29,056 | $6,090 | $22,966 |
Source: Public Records
Map
Nearby Homes
- 1770 Burnside Dr
- 1655 Sabatino Dr
- 1990 Fargo Way
- 1332 Coachman Ct
- 1280 O'Callaghan Dr
- 2252 Sycamore Glen Dr
- 1544 Woodhaven Ln
- 2435 Sycamore Glen Dr Unit 2
- 1970 Woodhaven Ln
- 2407 Sunny Slope Dr Unit 1
- 1218 Junction Dr
- 2688 Laguna Way
- 1897 Bonita Vista Dr
- 2002 Wabash Cir
- 2763 Blossom View Dr
- 1688 Round Mountain Cir
- 1973 Rio Tinto Dr
- 1051 Glen Martin Dr
- 914 Glen Martin Dr
- 2119 Avella Dr
- 1642 Union St
- 1712 Union St
- 01 Pyrenees Rd Unit 1
- 01 Pyrenees Rd
- 1632 Union St
- 1722 Union St
- 1711 Burnside Dr
- 1681 Burnside Dr
- 1741 Burnside Dr
- 1612 Union St
- 1651 Burnside Dr
- 1752 Union St
- 1761 Burnside Dr
- 1663 Union St
- 1631 Burnside Dr
- 1643 Union St
- 1723 Union St
- 1602 Union St
- 1762 Union St
- 1633 Union St