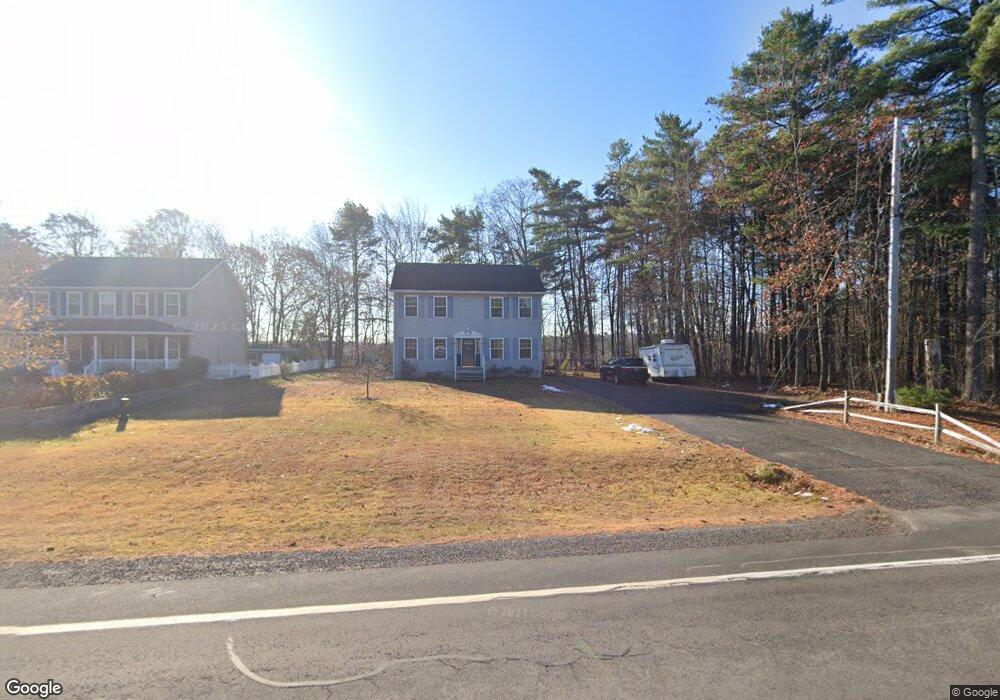
1663 State Route 3 Morrisonville, NY 12962
Estimated Value: $289,000 - $348,000
4
Beds
2
Baths
1,976
Sq Ft
$162/Sq Ft
Est. Value
About This Home
This home is located at 1663 State Route 3, Morrisonville, NY 12962 and is currently estimated at $319,130, approximately $161 per square foot. 1663 State Route 3 is a home located in Clinton County with nearby schools including Saranac High School.
Ownership History
Date
Name
Owned For
Owner Type
Purchase Details
Closed on
May 12, 2017
Sold by
Hill Anthony C
Bought by
Ruff John S
Current Estimated Value
Home Financials for this Owner
Home Financials are based on the most recent Mortgage that was taken out on this home.
Original Mortgage
$157,066
Outstanding Balance
$131,154
Interest Rate
4.25%
Mortgage Type
FHA
Estimated Equity
$187,976
Purchase Details
Closed on
Sep 25, 2012
Sold by
Hill Anthony
Bought by
Hill Anthony
Purchase Details
Closed on
Apr 19, 2010
Sold by
Hill Anthony
Bought by
Hill Anthony
Purchase Details
Closed on
Jun 5, 2009
Sold by
Hill Anthony
Bought by
Hill Anthony
Purchase Details
Closed on
Mar 28, 2002
Sold by
Hammond George
Bought by
Hill Anthony
Purchase Details
Closed on
Aug 25, 1997
Sold by
New Greenbrier and New Guyandot C
Bought by
Hammond George P and Hammond Deborah A
Create a Home Valuation Report for This Property
The Home Valuation Report is an in-depth analysis detailing your home's value as well as a comparison with similar homes in the area
Home Values in the Area
Average Home Value in this Area
Purchase History
| Date | Buyer | Sale Price | Title Company |
|---|---|---|---|
| Ruff John S | $161,000 | Thomas M. Murnane, Esq. | |
| Hill Anthony | -- | Gary Favro | |
| Hill Anthony | -- | Gary Favro | |
| Hill Anthony | -- | Robert Kagan | |
| Hill Anthony | $13,500 | Lori Cantwell | |
| Hammond George P | $20,000 | -- |
Source: Public Records
Mortgage History
| Date | Status | Borrower | Loan Amount |
|---|---|---|---|
| Open | Ruff John S | $157,066 |
Source: Public Records
Tax History Compared to Growth
Tax History
| Year | Tax Paid | Tax Assessment Tax Assessment Total Assessment is a certain percentage of the fair market value that is determined by local assessors to be the total taxable value of land and additions on the property. | Land | Improvement |
|---|---|---|---|---|
| 2024 | $6,855 | $270,200 | $34,400 | $235,800 |
| 2023 | $6,251 | $220,000 | $21,500 | $198,500 |
| 2022 | $6,228 | $220,000 | $21,500 | $198,500 |
| 2021 | $6,510 | $220,000 | $21,500 | $198,500 |
| 2020 | $6,161 | $185,000 | $22,900 | $162,100 |
| 2019 | $5,769 | $185,000 | $22,900 | $162,100 |
| 2018 | $5,769 | $185,000 | $22,900 | $162,100 |
| 2017 | $4,991 | $185,000 | $30,300 | $154,700 |
| 2016 | $8,471 | $185,000 | $30,300 | $154,700 |
| 2015 | -- | $185,000 | $30,300 | $154,700 |
| 2014 | -- | $185,000 | $30,300 | $154,700 |
Source: Public Records
Map
Nearby Homes
- 14 Twin Birch Ln
- 1918 State Route 3
- 1398 State Route 3
- 1976 State Route 3
- 7 Fatima St
- 45 Pine Ridge Dr
- 16 Kimberly Ln
- 3 Fay Ln
- 326 Rand Hill Rd
- 164 State Route 374
- 43 Maple St
- 1943 New York 22b
- 0 Church Rd
- 10 Joyce Ave
- 5 Darin Ave
- 0 Flat Rock Rd
- 135-139 Bradford Rd
- 4 Darin Ave
- 7 River St
- 320 Soper St
- 1659 State Route 3
- 1655 State Route 3
- 1651 State Route 3
- 1647 State Route 3
- 1641 State Route 3
- 6 Allegheny Rd
- 1727 State Route 3
- 2 Allegheny Rd
- 8 Allegheny Rd
- 3 Allegheny Rd
- 1 Allegheny Rd
- 5 Allegheny Rd
- 9 Allegheny Rd
- 7 Allegheny Rd
- 1740 State Route 3
- 2 Blueberry Hill Rd
- 4 Blueberry Hill Rd
- 1746 State Route 3
- 6 Blueberry Hill Rd
- 1733 State Route 3 Unit 1739